

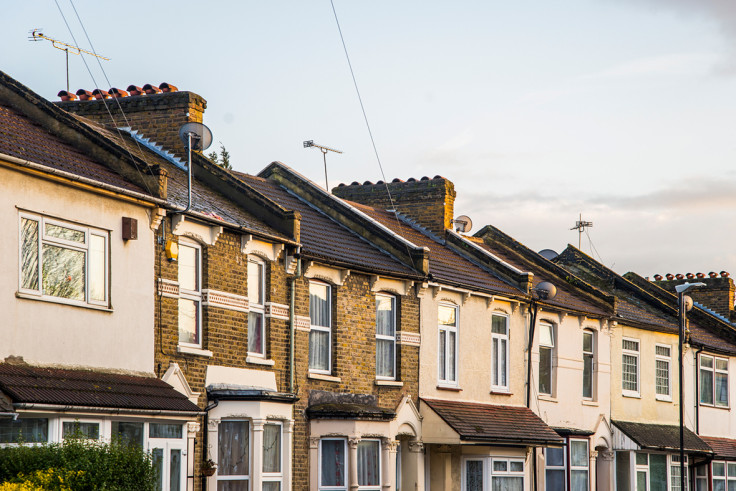
London house prices rocket to 14.2 times average pay amid severe housing shortage
Hometrack says in UK Cities Index for October 2016 that 'impetus for house price growth shifting north'.

London house prices are now on average 14.2 times earnings, the highest on record and the biggest multiple of anywhere in the UK. For the UK as a whole, the price-to-earnings ratio is 6.5 times, meaning London is more than double the country's average.
That is according to the Hometrack UK Cities Index for October 2016. In second place was Cambridge at a ratio of 13.8 times, then Oxford at 13.4 times. The most affordable of the country's 20 largest cities which comprise the index was Glasgow at 3.7 times.
Hometrack said the average price in London had risen by 86% since its 2008 low, reaching £482,800. The capital is in the grip of a housing crisis amid intense demand and an ongoing shortage of homes, with only around half the 50,000 new units needed a year delivered, fuelling price rises well ahead of elsewhere in the country.
But that trend may soon reverse. "The impetus for house price growth is shifting from the affordability constrained cities in southern England to cities in the midlands and the north of England," said Richard Donnell, insight director at Hometrack. "Regional cities have more attractive affordability levels and house prices have significant potential upside for growth in the near term subject to the outlook for the economy.
"In cities where affordability levels are stretched fewer households are able to participate in the market and this reduces levels of turnover and leads to lower levels of house price growth. This process is underway in London where the annual rate of growth is close to its lowest level for three years and where the top end of the market is already registering falling prices."
The index said the average house price in a UK city rose 8.4% year-on-year in October to £241,200. The UK's average price as a whole increased 7% to £203,700.
House price to earnings ratio by city: how they compare
| City | Average annual earnings 2016 | Price to earnings ratio - current | Long run average (2002-16) |
| London | £33,720 | 14.2 | 9.6 |
| Cambridge | £30,633 | 13.8 | 9.5 |
| Oxford | £30,633 | 13.4 | 10.4 |
| Bournemouth | £26,473 | 10.2 | 9 |
| Bristol | £28,007 | 9.3 | 7.2 |
| Southampton | £27,245 | 8 | 6.8 |
| Portsmouth | £28,074 | 7.8 | 6.9 |
| Cardiff | £27,633 | 6.9 | 6.5 |
| Edinburgh | £29,104 | 6.9 | 6.5 |
| Aberdeen | £28,824 | 6.3 | 5.7 |
| Leicester | £25,343 | 6.2 | 5.7 |
| Manchester | £26,310 | 5.6 | 5.2 |
| Birmingham | £25,888 | 5.6 | 5.4 |
| Leeds | £27,492 | 5.6 | 5.6 |
| Nottingham | £26,530 | 5.2 | 5 |
| Sheffield | £25,745 | 5 | 4.8 |
| Newcastle | £25,698 | 4.8 | 5.1 |
| Liverpool | £25,503 | 4.4 | 4.7 |
| Glasgow | £30,304 | 3.7 | 4.1 |
House prices by city: how they have changed
| City | Average price | % yoy October 2016 | % uplift from post-2008 low |
| Bristol | £259,400 | 10.60% | 61% |
| London | £482,800 | 9.10% | 86% |
| Portsmouth | £218,600 | 8.30% | 42% |
| Cardiff | £193,000 | 8.00% | 32% |
| Birmingham | £145,500 | 7.70% | 25% |
| Manchester | £148,100 | 7.70% | 25% |
| Southampton | £218,200 | 7.50% | 42% |
| Oxford | £415,000 | 7.00% | 72% |
| Bournemouth | £271,400 | 6.90% | 42% |
| Nottingham | £138,300 | 5.60% | 27% |
| Liverpool | £112,700 | 5.50% | 15% |
| Sheffield | £129,300 | 5.50% | 18% |
| Leeds | £153,100 | 5.50% | 21% |
| Cambridge | £420,600 | 5.40% | 84% |
| Leicester | £156,500 | 5.40% | 28% |
| Glasgow | £114,700 | 4.00% | 13% |
| Edinburgh | £203,200 | 3.50% | 20% |
| Newcastle | £122,600 | 3.10% | 12% |
| Belfast | £126,700 | 2.10% | 22% |
| Aberdeen | £180,500 | -8.10% | 15% |
| 20 city index | £241,200 | 8.40% | 52% |
| UK | £203,700 | 7.00% | 33% |
Source: Hometrack UK Cities Index October 2016
© Copyright IBTimes 2024. All rights reserved.


