

What You Need to Know: UK Wages Over the Past 40 Years


IBTimes UK takes a look at the Office for National Statistics' latest release on wages. The research body has investigated how pay-packets have transformed over the past 40 years. The information comes ahead of 2015 General Election, and the cost of living has become an important area of debate.
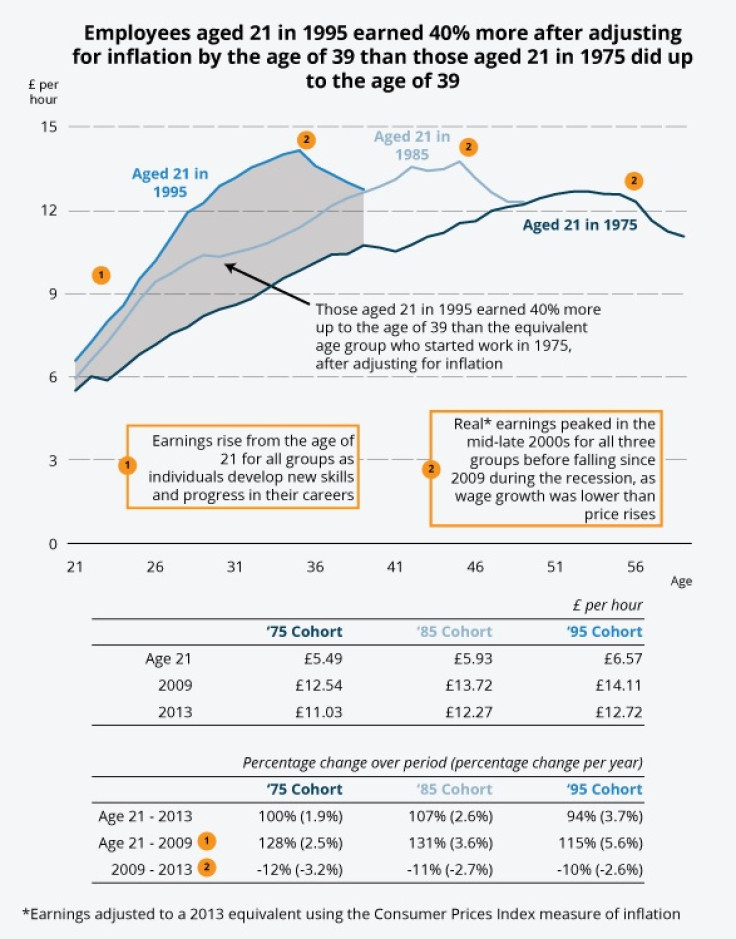
Median earnings
The ONS found that 21-year-olds in 1975 have fared worse in terms of average pay over their career to 2013 than those who were 21 in 1985 and 1995.
For example, adjusting for inflation to put wages into a 2013 equivalent and comparing the age range 21 to 39 shows that those who started work in 1995 earned 40% more than their counterparts who started work in 1975.
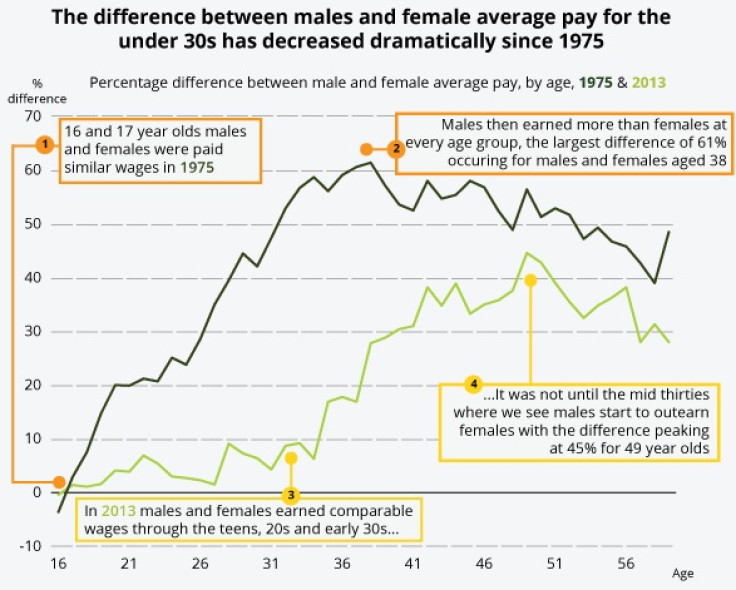
Male and female earnings
In 1975, 16 to18-year-old males and females were paid similar wages, however moving past the age of 18 men earned more at every age group. The highest percentage difference was for 38-year-olds where men earned on average 61% more than women.
But In 2013 the difference between male and female pay stayed relatively close to zero up to around the age of 30.
The difference then rises up to peak of 45% more between males and females aged 49, according to the ONS.
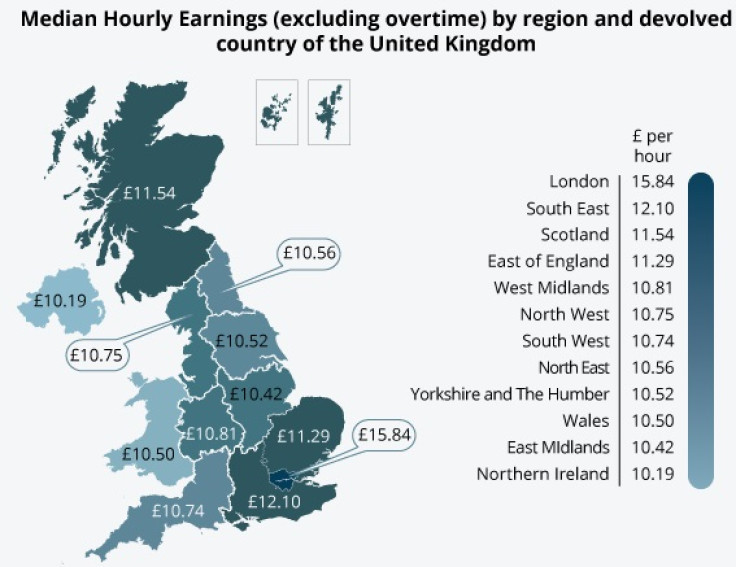
Regional average pay
The ONS found that average hourly pay in the UK in 2013 was £11.56 and the region with the highest average pay was London where across all employees average hourly pay excluding overtime was £15.84.
The research revealed that the lowest hourly earnings were in Northern Ireland at £10.19 per hour.
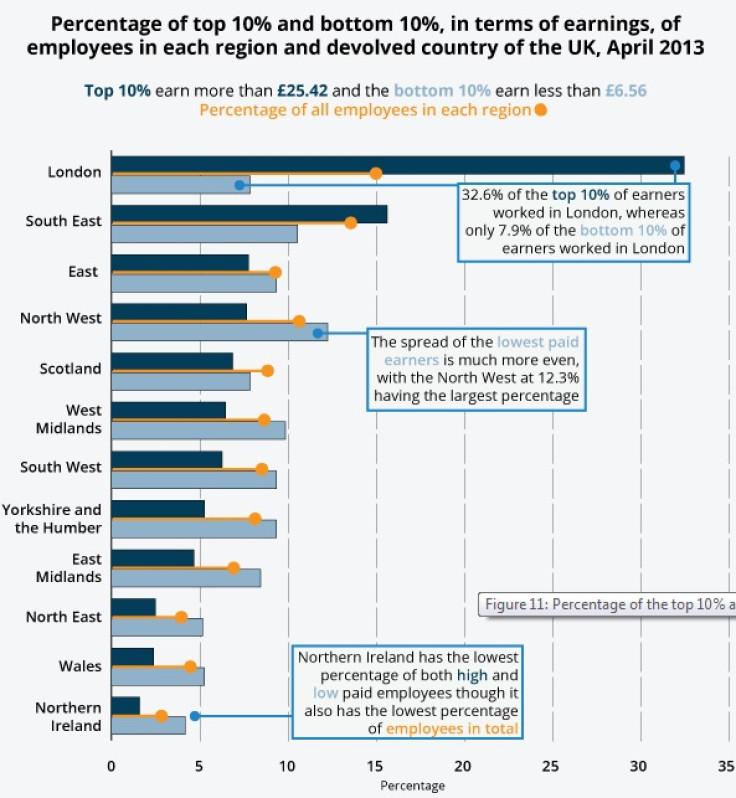
Wage inequality
The ONS looked at how the top and bottom earners are distributed across regions, revealing that almost one third (32.6%) of the top 10% of earners, those who earned above £25.42 per hour, worked in London, compared with just 7.9% of the lower paid, who earned less than £6.56 per hour.
But for the lowest paid earners the study found that the spread was more even.
The ONS said 12.3% of the lowest paid workers worked in the North West, the largest portion of this group in any given region, while the smallest portions of both the top and bottom earners worked in Northern Ireland though this may be a reflection of the smaller overall population size in Northern Ireland.
© Copyright IBTimes 2024. All rights reserved.


