

6 Bearish Patterns to Implement Into Your Trading Strategies
As you keep putting in the effort necessary to expand your trading vocabulary, you're likely to come across several bearish patterns that could potentially indicate a downtrend is coming. For there to be any kind of reasonable grounds for assumption, note that the current state of the market should be at least somewhat bullish.
If you notice any of the following bearish patterns forming, the market could be due for a reversal soon:
1. Hanging man
A hill-like pattern with a hanging man shape in the middle could indicate a possible forthcoming market reversal. The prevailing characteristic for these patterns is to be accompanied by a long lower shadow with a smaller corresponding body. Typically, you will see the hanging man pattern at the end of a bullish cycle where the wave seems to have reached its highest point but is now subsiding. When you notice this pattern during your trading endeavors, it might be a signal to enter a short position.
2. The evening star
The evening star is another powerful indicator that the current uptrend is about to meet its end and transform into a downtrend. One of its key characteristics is the presence of three candlesticks:
- A bullish candlestick that is large and bullish in nature
- A candle with a smaller body
- A candlestick that is blatantly bearish
Typically, you will see these making an appearance when an uptrend is in full swing, but is about to undergo a trend shift and eventually become a downtrend.
3. Bear flag candlestick
Unlike the above, the bear flag pattern indicates a continuation of the ongoing market trend. As ThinkMarkets describes it, this is a candlestick chart pattern that looks like a flag with a flagpole. In general, don't expect this phase to be too lengthy. When you notice the bear flag pattern, the sellers are likely pushing the price to fall even lower. Since it typically comes with favorable risk-to-reward ratios, take it as a strong signal to base your next trading decision on (however, you should be careful for the pattern to form in its entirety before making a move).
4. The three black crows
One of the traits you'll observe with the three black crows pattern is that it features multiple candlesticks. You can treat it as a signal to predict that the uptrend is about to reverse and become a downtrend to a reasonable degree. If you've noticed an emergence of a hill-like pattern followed by a three consecutive days of going downhill after reaching the top, it's reasonable to assume you're dealing with the three black crows pattern indeed. In case you've identified one of these patterns forming, you wouldn't be in the wrong for taking a short position.
5. Dark cloud cover
Once an uptrend is about to reach an end, you may notice a dark cloud cover pattern forming. This is one of the bearish patterns that forecast an uptrend may be ending and that the proverbial winter is coming in the market. To identify it, be on the lookout for two candlesticks, the first one of which is a bullish one and the second – a bearish candlestick. Before the dark cloud cover assumes its final shape, it's typical to see prices rising, only for them to fall shortly thereafter.
6. Bearish engulfing
Last but not least, we have the bearish engulfing pattern that marks a reversal in market trends from bullish to bearish as sellers are increasing their pressure on the stock price. A price that's rising and then gradually takes a turn for the worse could draw out a bearish engulfing shape. When dealing with one of these, look close to see if you can spot the formation of two candles, with the first of them being green and the second – red. Compared to the hanging man pattern we've mentioned before, a bearish engulfing tends to have a flatter curve.
Bear and bull markets are like the tide. After every rain, there's bound to be sunshine.
Conclusion
These bearish patterns make for an important addition to your trading vocabulary. Once you've trained your eye to spot them, this can give you a valuable clue and help you forecast in what direction the market is headed. Keep in mind that trading is a game of speculation and educated guessing. As such, we never think in terms of certainties, but rather in what is the most likely thing that's about to happen based on a keen observation of the charts.
-
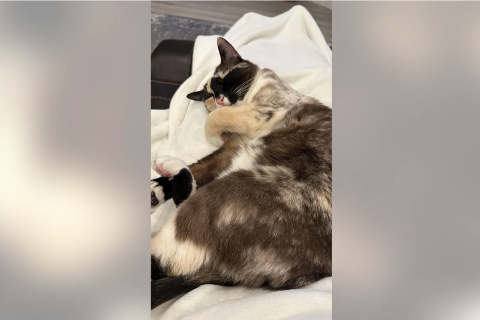
Utah Couple Doesn't Know Cat Jumped Into Amazon Package, Accidentally Ships It to California
-

How Are Female Tech Firms Fighting the Employment Crisis in the West Bank?
-

Italian PM Has British Newborn With Heart Defects Airlifted to Rome for Treatment Unavailable in UK
-

Sugar Baby Gets 9 Years In Jail For Scamming $1M From Men And Selling How-to Manuals


