

Brent crude: Charts show short-term selling pressure even as broad uptrend intact

Moving off last week's seven-week low, spot Brent touched a six-day high on 9 June, but it is testing a channel resistance early Wednesday in Asia, so some technical selling is likely in the commodity ahead of the Energy Information Administration (EIA) stockpiles data later in the day.
At the same time, a big picture analysis shows that the technical support provided by the same channel seems more difficult to break, keeping the chances of new multi-month highs in the coming weeks, especially in the wake of fundamental tailwinds for the commodity forecast by the EIA in its Short Term Energy Outlook published on 9 June.
Brent crude for immediate delivery made a 4% jump on Tuesday, breaking through the resistance at $63.85 and hitting as high as $65.20. Early on 10 June, the oil variety traded a range of $65.13-$64.85.
The 9 June EIA report showed that higher oil prices in May were mainly due to signals of higher global demand growth, expectations for declining U.S. tight oil production, and the growing risk of supply outages in the Middle East and North Africa.
North Sea Brent crude oil prices averaged $64/barrel in May, a $5/b increase from April and the highest monthly average of 2015, the report noted.
EIA has forecast Brent crude oil prices to average $61/b in 2015, and $67/b in 2016, which is $3/b lower than last month's outlook. West Texas Intermediate (WTI) prices in both 2015 and 2016 are expected to average $5/b less than the Brent price, EIA said.
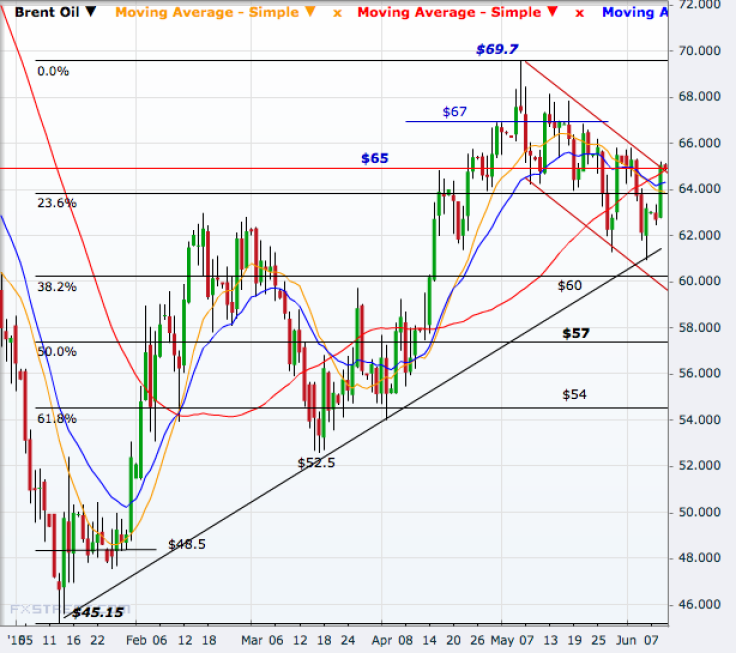
Charts show that a decisive break of $65 will open doors to new multi-month highs above the May peak of $69.70 although $66 and $67 may be watched for mild resistance on the way.
On the downside, $60 makes a channel support for the commodity, also endorsed by the 38.2% Fibonacci retracement of the January-May rally.
However, only a break of the 50% line of $57 will significantly weaken that uptrend, but then $54 and $52.5 may be watched ahead of new multi-year lows below the January trough of $45.15, which was the lowest since early 2009.
Crude oil stocks in the U.S. have been forecast to have decreased by 1.7 million barrels in the week to 5 June, less than the 1.95m barrels drop reported for the previous week, which was the fifth straight week of a drop in the stocks.
The weakness in the dollar is also helping crude prices. The USD index is trading near 95.10, near the two-week low of 94.66 hit last week.
© Copyright IBTimes 2024. All rights reserved.


