A decade of evolution research got its math all wrong
Palaeontologists have been using a method that turns their results into nonsense.

More than 150 studies on fossils published in the past decade have used maths that doesn't make sense, a new study claims.
"Since 2007 when it was presented, many people fell upon the method. It has been cited about 150 times," study author Mike Benton, a palaeontologist at the University of Bristol, told IBTimes UK. The research is published in Methods in Ecology and Evolution.
The method was used to try to make up for an incomplete fossil record, as not animals of all species become fossils, says Benton. There is a bias in the record towards animals with spines or shells, for example, as they are more likely to become fossilised than animals that are soft all the way through.
To find out what part of the record is real and what part is bias, the method assumed that there was a relationship between the amount of rock deposited in a given era and the number of animals made into fossils at that time. So if an awful lot of rock was laid down, you would expect to be able to find a correspondingly large number of fossils in it.
Benton's co-author Manabu Sakamoto of the University of Reading was the one to first spot a fundamental flaw in the method that makes nonsense of the data. The flaw is that when sorting the data in the study, they unlink bits of information that need to stay together in order to make sense.
How does this work? Think about Usain Bolt. His muscle power is related to how fast he can run. Likewise, other athletes' muscles affect how fast they can run. But you can't muddle up different athlete's measurements. "In this method, they've decoupled the two: so the running speed of Usain Bolt is linked with the muscle power of Greg Rutherford." This leads to garbled results, Benton says.
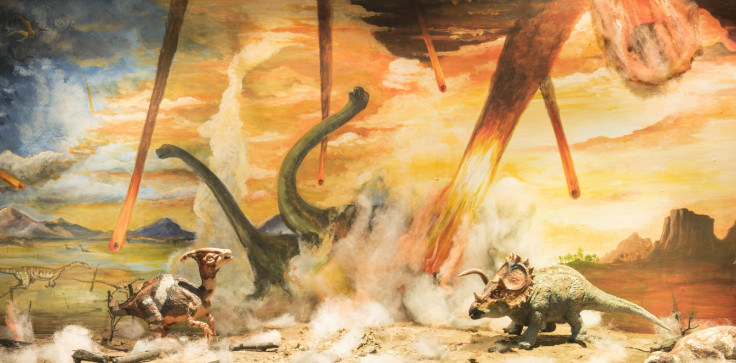
What this means for the dinosaurs
This method affected palaeontologists' interpretation of whether animals were increasing or decreasing over time.
The first major application was a study on dinosaurs led by Paul Barrett of the Natural History Museum in London, published in 2009. "The point was they were applying the method, correcting the data – or so they thought – and then making very definite claims," says Benton. That paper made a big impression and has been heavily cited.
"They said they don't accept the raw data, we now process the data using this method and this is what we get." This turned Barrett's study on its head, Benton says. "At the end of the dinosaurs – according to the raw data the diversity is rising. According to their 'corrected' data the diversity is falling, and so that gives a very different picture of the extinction of the dinosaurs."
Crucially, Benton says, those who used this method believed that it brought their data closer to the truth than the raw data was. "In a sense it was rewriting history. This is the narrative that gets into the textbooks: whether dinosaurs are expanding or reducing, the nature of this particular event in the history of life," he says.
Benton says that until someone can find a method that makes more sense than this one, scientists would be better off just looking at the raw data. While it would be ideal to have a replacement method to suggest, it's still important to point out the problems with this method, he says.
"Where the method has been applied, the output is meaningless."

© Copyright IBTimes 2025. All rights reserved.
- MOST READ