

India rupee: PMI data offsets strong dollar impact but there's trouble ahead

Indian rupee showed some strength on 2 January despite a super strong greenback as a sharp rally in local shares and a much better than expected PMI number aided a rebound from its early lows.
However, upbeat dollar momentum and technical positioning keep rupee a sell which is likely to fall to new records this year.
USD/INR ended at 63.29 on Friday, after trading at a high of 63.49 during the day. Thursday's close was 63.35.
Traders said the 1.4% rally in main local share indices strengthened the view that more inflow into the Indian capital markets will follow in the near future. Many banks opted to sell dollars at the early gains of the pair, they added.
India's HSBC/Markit manufacturing PMI rose to a two-year high of 54.5 for December, mainly helped by the sharp expansion in consumer goods, Markit said on Friday.
Analysts at HSBC said the steep rise in new orders from the consumer sector more than offset a slowdown in new order growth from investment goods, and added that easing price pressures in the country means the Reserve Bank of India will be ready to ease rates some time in 2015.
"In line with falling commodity prices over the last few months, input price inflation was modest, and this trend was also mirrored in output prices. With the disinflationary trend gaining ground, the RBI is expected to find space for some rate cuts in 2015," said Pranjul Bhandari, chief India economist at HSBC.
Outlook dismal
Despite the good fight the rupee has shown against the dollar on the first liquid day of the new year, it doesn't seem strong enough to withstand the huge global wave of dollar buying in the coming days.
The USD index, the gauge that measures the greenback's trade weighted strength against a basket of majors, was up more than 0.55% on the day and at a new multi-year high of 90.76 by the time rupee ended day's trading.
The index continued higher later and was at 90.91 by around 14:00 GMT, translating to a 0.72% daily gain.
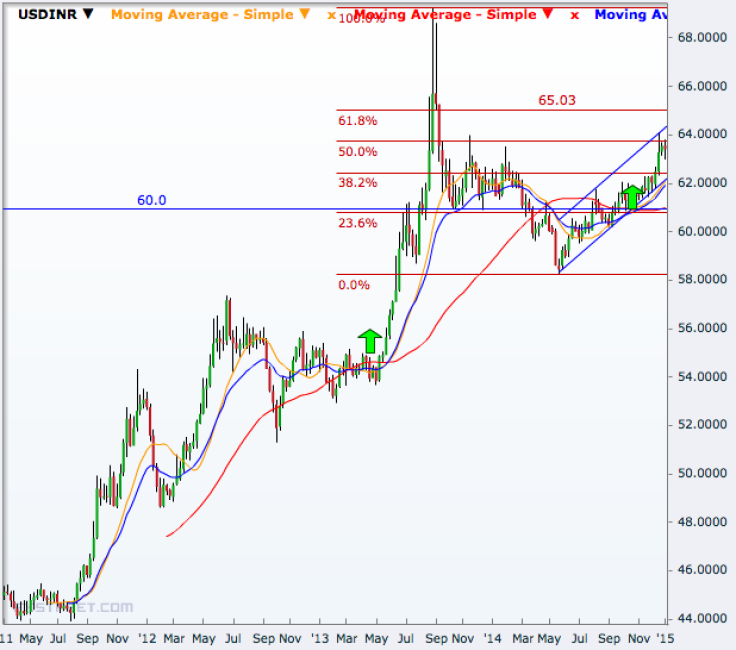
Moreover, technical charts project weaker levels like 65.0 as the next possible target for the rupee.
A close look at the 50-week moving average and 14-week moving average shows that the mid-October bullish crossover for USD/INR is similar to the May 2013 bullish crossover that had finally taken the pair to its record high (rupee's record low) of 69.23 in the next three months.
If that is going to repeat, then 65.0 may offer some resistance for the pair as it coincides the 61.8% Fibonacci retracement of the selloff from September 2013 to May 2014.
Further up, round numbers like 66, 67, and 68 may show some relevance otherwise, there are no technically strong resistance until the last year peak of the pair.
© Copyright IBTimes 2024. All rights reserved.


