India: Transport, domestic sectors ahead in greenhouse gas emissions
Transport and domestic sectors were found to be the biggest emitters of greenhouse gases in a study done in seven of India's major cities.
The study, done for the period 2009-2010, shows that while high rise buildings with glass façades, inefficient heating systems and waste mismanagement pushed up emissions from the domestic sector in Kolkata, poor public transport systems in Bangalore and Hyderabad sent vehicular emissions soaring in those cities.
Published in the journal Renewable And Sustainable Energy Reviews, the study puts Delhi on top as the biggest emitter at over 38 billion kg (38 million tonnes) of carbon dioxide equivalent overall emissions, followed by Greater Mumbai at 22.7 billion kg and Chennai at 22.1 billion kg.
Kolkata at 14.8, Bangalore at 19.8, Hyderabad at 13.7 and Ahmedabad at nine billion kg were the other cities whose emissions for the year were calculated sector-wise.
Chennai topped the list for emissions per capita as well as for the per GDP figures of CO2 equivalent.
Buildings' consumption up
As more and more high-rises come up in these cities, poor selection of architecture has seen consumption of electricity rising.
"The study shows the zone with glass façade buildings consume electricity of 14000-15500 units per person per year compared to other zones where it is 1300-1500 units per person per year," TV Ramachandra, from the Indian Institute of Science's Centre for Ecological Sciences told IBTimes UK.
"This illustrates the damage of bad architecture on the environment - higher electricity means higher GHG," he said.
India has a green building code devised by the Bureau of Energy Efficiency but the code introduced in 2007 is of a voluntary nature. However, the government plans to enforce minimum energy standards for commercial buildings by 2017.
Residential apartments would not fall in its purview.
The transport sector accounted for only 13% of Kolkata's total emissions due to an efficient public transport.
For Bangalore with a poor public transport network, emissions stood at 43% and for Hyderabad at 56% of overall emissions.
In terms of figures for transport sector, Delhi topped at 12.4 billion kg and Bangalore at 8.6 billion kg of CO2 equivalent.
Transport emissions
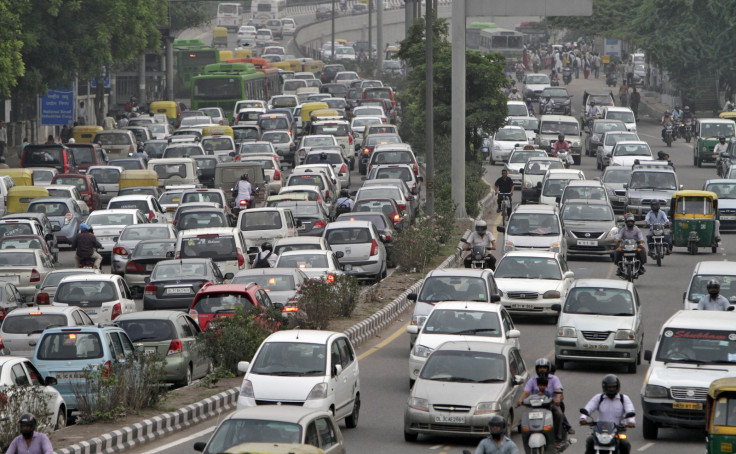
Delhi leads the transport emissions chart owing to the large number of vehicles, says the study.
As per the statistics of Transport Department in Delhi, the total number of vehicles in Delhi is more than the combined total vehicles in Mumbai, Chennai and Kolkata.
Delhi has 85 private cars per 1000 population against the national average of eight private cars per 1000 population.
A shift from car-centric transport to one based on public transport, walking and cycling can reduce carbon dioxide emissions by as much as 1542 megatonnes by 2050, said a report from the Institute for Transportation and Development Policy (ITDP) and University of California, Davis last year.
Transportation is the fastest growing source of carbon emissions globally and accounted for over 2,000 megatonnes of CO2 in 2010.
In 1991, there were 20 million vehicles in India. The number had skyrocketed to 140 million in 2011, and by 2030, vehicle population is expected to reach a staggering 400 million.
Waste mismanagement
The study is the first to assess emissions from city wastes in terms of methane released from landfills where waste is heaped without being segregated.
Waste-related emissions ranged from 3% of Chennai's GHG footprint to about 8% of Greater Mumbai's GHG footprint.
While seeming insignificant, the figures have to be seen in the context of methane having a 21-fold stronger greenhouse effect than carbon dioxide, as Ramachandra notes.
Ramachandra believes there is a need for constant monitoring of greenhouse gases and that controlled growth can be achieved using alternative energy sources like wind and solar in many of the energy consuming sectors.
The study gives the latest emission figures as 2009 is the latest year for which pooled emissions data is available. Ramachandra and colleagues Bharath H Aithal and K Sreejith linked the GHG emissions data with population and economic growth, two factors closely associated with fuel consumption.
Aggregation of CO2, methane and nitrous oxide emissions gave the GHG footprint for each city.
India's rank in emissions
In the year 2004, India had last submitted its Initial National Communication to the UNFCCC Secretariat on efforts to assess the greenhouse gas emissions of anthropogenic origin and removal by sinks for 1994 base level.
Currently, India is preparing its second national communication to the UNFCCC for the base year 2000.
The IISc study gives the latest figures on emissions from selected cities.
India's per capita emissions were still low at 1.9 tonnes in 2013, but its total emissions are next only to China and the US and likely to overtake those of the EU by 2019.
Countries are aiming to reach agreement in Paris later this year on a deal to limit emissions that will come into force from 2020.
Unless the global surface temperature rise is restricted to no more than 2C compared with pre-industrial levels, the IPCC has warned that the world will see irreversible catastrophic climate change.
© Copyright IBTimes 2025. All rights reserved.
- MOST READ