

Technical Outlook: Is Indonesia Facing a Currency Crisis?


Indonesia's rupiah is headed south, fuelled by rising oil prices, and is nearing the 2008 lows once again.
The USD/IDR is currently trading a little below the record 12,500 mark touched in 2008, but the currency situation now is not as grave as it was during the 2008 crisis, at least for corporate investors.
At the 2008 trough of 12,503, the rupiah was about 25% weaker from its end-2007 level. And the JSE composite, Indonesia's benchmark stock index, had fallen nearly 35% during the same period.
From the 2008 lows, stocks had rocketed, and are now 345% higher. Rupiah had strengthened to 8,480 in July 2011 but had been on a weakening trend since then.
Even if the levels before the 2008 fall are considered, the stock rally looks impressive. The rupiah is about 19% weaker than its end-2007 level while the main stock index is about 76% stronger.
Why Corporates Are Not Moved
But Indonesian corporates are well positioned now, as they had learned a lot from earlier crises, analysts say. A Financial Times article on 17 June says that companies and banks have been more restrained about how much they borrowed and for how long, and many without dollar revenues have put in place hedging strategies.
In the banking sector, unhedged foreign currency exposure on average accounts for only 2% of banks' capital, according to Fitch. With capital adequacy ratios at about 18% and gross non-performing loans at about 2%, the sector looks resilient.
However, the FT article quotes the chief executive of a local bank who warns that the relative strength of Indonesia's big four lenders, which control more than 40% of loans and deposits, could be masking weaknesses at some smaller banks.
With the outlook for the rupiah uncertain, Indonesian companies are not out of the woods quite yet, says Sarvesh Suri, country manager for the International Finance Corporation, the World Bank's private sector lending arm.
But for now, investors' greatest concern will be falling profit margins rather than a potential systemic corporate collapse.
Recent Issues
The outbreak of a civil war in Iraq and the impact it had on global oil supply outlook have been reflected in the Indonesian currency, thanks to the heavy share of oil payouts in Indonesia's overall import bill.
Indonesia's trade balance fell to a deficit of $1.97bn in April, data on 2 June showed. It compares with a surplus of $1.52bn in December, as per February data.
Rupiah strengthened 8% to 11,271 from near 12,210 following the February release but has weakened nearly 7% since April when balance was still a surplus.
World Bank View
A World Bank article published on 23 June provides a growth outlook for the country.
The bank says that Indonesia faces a risk of slowdown in long-term growth, as recent growth was partially driven by a very favourable external environment -- the commodity boom of 2003-2011 combined with low global interest rates since 2009.
"To avoid risks associated with higher unemployment, growth above 5% is vital. It is required for Indonesia to escape the threat of a middle income trap," the article said.
At the same time, data shows that GDP growth has been on a declining trend at least over the last year. The growth slowed to 5.21% in the first quarter of 2014, data on 5 May showed. It compares with 6.02% in Q1 2013.
Technical Outlook For USD/IDR
Indonesian rupiah fell to a new 4-1/2-month low of 12,087.50 against the US dollar on 25 June. The rupiah has fallen more than 3.4% so far in June.
The Indonesian unit is facing tougher days compared with its regional peers, charts show. USD/IDR is not far away from 12,500, the record high touched in December 2008.
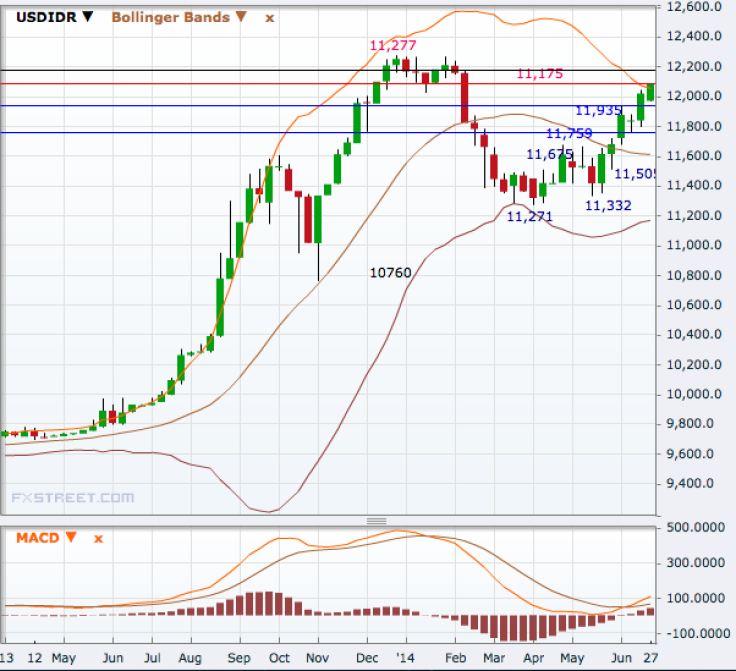
On the way up, the pair has its first resistance in the 12,125-175 region, a break of which will open doors to 12,277, the five-year high hit last December.
Immediate levels on the downside are 11,935 and then 11,759, the 50% retracement of the December 2013 to April this year downtrend. A break of the Fibonacci level will significantly weaken the uptrend since April and increase risks of a downtrend.
The next levels are 11,675 and 11,505, the 38.2 and 23.6 levels, ahead of 11,332 and 11,271, the 5-month low hit in April.
However, with the pair having broken above the upside Bollinger band and MACD triggered a bullish signal on the weekly chart, it is poised to hit new highs and a new record is close by.
© Copyright IBTimes 2024. All rights reserved.


