

Euro Sheds 1,000 Pips vs Dollar in Two Months and Eyes 1.20 With ECB, US Jobs Data in Focus

The euro has shed 1,000 pips in less than two months following the impact of divergence in policy rates of the US and the European Central Bank.
September inflation data from the common currency area has just added to the concerns of the region.
The EUR/USD broke below the crucial support line of 1.2661 on 30 September after data showed that the core consumer price inflation for the eurozone slowed to 0.7% in September from a year earlier. The headline rate eased to 0.3% from 0.4%.
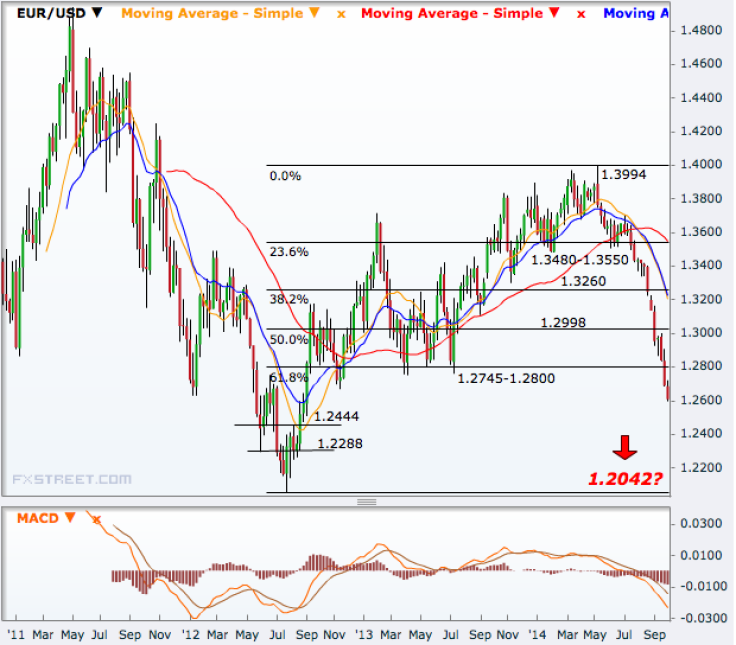
With the fall over the past four months, the pair has broken all the Fibonacci retracements of the July 2012 to May 2014 rally that had taken it to a 36-month high of 1.3994 in early May. It touched a two-year low of 1.2590 on Tuesday.
If the downward momentum is maintained, the euro will all likely hit the 1.20 mark in another 30 days or so, technical charts show.
Additional dovish rhetoric from the ECB at its policy review on Thursday or a stronger reading of the US jobs data later in the week can make it easier.
It was in July that the euro started falling sharply and at the low on Tuesday, the common currency was down 1,059 pips from the end-June level. September is the third straight month of losses for the pair, which is on track to end the three-month period 8% lower.
The dollar index at the same time rallied to a new four-year high of 86.07 on Tuesday, and is up 7.9% from end-June when the sharp rise began.
The upward revision of Q2 GDP data on Friday was the latest indication that the US is gearing up for a sooner rate hike while the eurozone is seeing sharp divergence with the likelihood of further easing in the monetary policy setting.
Data from the US Commodity Futures Trading Commission (CFTC) show that the sharp rally in the US dollar over the past few weeks has forced speculators to either significantly lower their buy-side positions or push down to the sell-side area with regard to majors like the euro, the Aussie dollar and New Zealand dollar.
Technical Analysis
With all the Fibonacci levels already broken, the pair eyes its immediate support at 1.2444. It will then have only one more level to pass, that is, 1.2288, before retesting the July 2012 low of 1.2042.
On the higher side, the 1.2661 support has now turned a resistance but it seems to be a weak one compared to the 1.2745-1.2800 region.
A break of that will open 1.2998, beyond which the upside momentum can gather pace easily as the uptrend since mid-2012 will be back in action.
However, a break of 1.3260 will be essential for making the retest of the May high a possibility. On the way up, the 1.3480-1.3550 region will be an area to watch.
© Copyright IBTimes 2024. All rights reserved.
-

Asian Markets Mixed As Global Rally Stalls, Eyes On Yen
-

Brit Gets World Record As Youngest To Complete London Marathon With Down Syndrome
-

Italian PM Has British Newborn With Heart Defects Airlifted to Rome for Treatment Unavailable in UK
-

Sugar Baby Gets 9 Years In Jail For Scamming $1M From Men And Selling How-to Manuals


