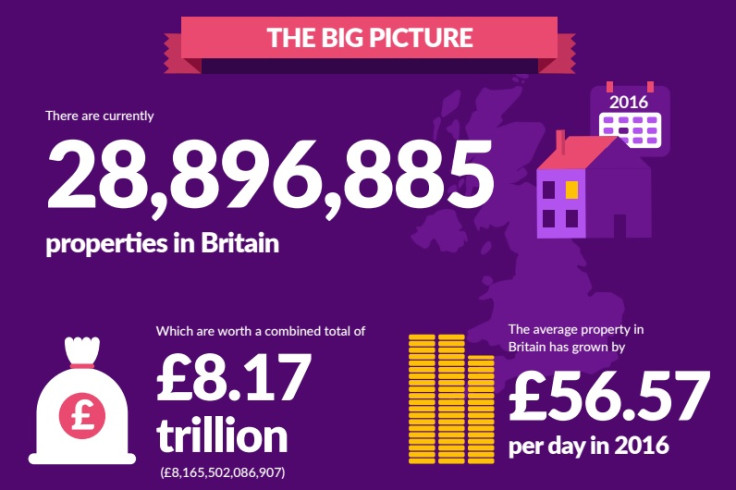
Over £8 trillion — the total value of UK residential property in 2016
The total value of residential property in the UK is bigger than the Japanese economy.

Zoopla, the property listings website, thinks it has come up with the total value of the housing market — £8.17tn ($10.1tn). If that were a GDP figure, it would be the third largest economy in the world, behind China and the US, but ahead of Japan and Germany.
And, while only indicative, that number is 7.35% higher than a year before, reflecting the growth in house prices over 2016 as a housing shortage in parts of the country drives property values up further, defying fears over the vote to leave in the 23 June referendum on EU membership.
Lawrence Hall, spokesman for Zoopla, said it "certainly been a historic year, with the events of the past six months giving rise to potential political uncertainty. However, the property market – it seems – remains resilient and property values across Britain have continued to grow."
The Zoopla data also revealed that the East of England was the region that had seen the largest increase in house prices since January 2016. The average price had risen 11.56% over that period to £358,401.
London, where prices are highest and which has seen the most rapid growth in recent years, slipped to ninth place as affordability issues for first-time buyers and tax hikes for investors bite down on demand. The city's average price grew 5.12% to £680,593.
"As city centre living becomes increasingly less affordable, our data shows significant increases in property values in popular commuter towns," Hall said. "Towns such as Leatherhead in Surrey and Diss in Norfolk, which offer commuting times to London of under one hour and 90 minutes respectively, have proved particularly desirable."
Average property value and increase by country
| Ranking | Country | Current average value | % increase in value since January 2016 |
| 1 | England | £325,575 | 7.59% |
| 2 | Scotland | £185,355 | 5.56% |
| 3 | Wales | £179,074 | 3.8% |
Average property value and increase by region
| Ranking | Region | Current average value | % increase in value since January 2016 |
| 1 | East of England | £358,401 | 11.56% |
| 2 | West Midlands | £220,993 | 8.74% |
| 3 | South East England | £411,736 | 8.44% |
| 4 | South West England | £297,054 | 7.88% |
| 5 | North West England | £190,005 | 7.57% |
| 6 | East Midlands | £209,183 | 7.42% |
| 7 | Yorkshire and The Humber | £173,362 | 5.58% |
| 8 | Scotland | £185,344 | 5.56% |
| 9 | London | £680,593 | 5.12% |
| 10 | Wales | £179,096 | 3.80% |
| 11 | North East England | £187,683 | 2.41% |
Top 10 post towns for price growth since January 2016
| Ranking | Town | Current average value | % increase in value since January 2016 |
| 1 | Diss, Norfolk | £305,896 | 16.20% |
| 2 | Leatherhead, Surrey | £833,631 | 14.70% |
| 3 | Southall, London | £382,153 | 14.55% |
| 4 | Crook, County Durham | £121,949 | 14.45% |
| 5 | Seaford, East Sussex | £351,888 | 14.29% |
| 6 | Woodford Green, Essex | £616,925 | 14.28% |
| 7 | Chippenham, Wiltshire | £338,102 | 14.14% |
| 8 | Northwood, London | £915,207 | 14.13% |
| 9 | Shoreham-By-Sea, West Sussex | £387,248 | 13.80% |
| 10 | Upminster, Essex | £552,561 | 13.77% |
Bottom 10 post towns for price growth since January 2016
| Ranking | Town | Current average value | % increase in value since January 2016 |
| 1 | Aberdeen, Aberdeenshire | £217,234 | -2.83% |
| 2 | Llandudno, Conwy | £195,623 | -2.38% |
| 3 | Ashington, Northumberland | £108,611 | -2.31% |
| 4 | Bangor, Gwynedd | £165,673 | -1.03% |
| 5 | Newquay, Cornwall | £264,892 | -0.81% |
| 6 | West Drayton, London | £360,604 | -0.43% |
| 7 | Ossett, West Yorkshire | £167,224 | 0.02% |
| 9 | Tredegar, Blaenau Gwent | £93,458 | 0.25% |
| 10 | Pontypridd | £144,413 | 0.51% |
Source: Zoopla, December 2016
© Copyright IBTimes 2025. All rights reserved.
- MOST POPULAR IN Property