

These maps and graphs show how Donald Trump defied polls to win US election
Ten visuals that explain where Trump's support was the strongest.

Those who put their faith in the polls had their world turned upside down when Donald Trump defied the numbers and won the 2016 US election. But there were a number of outliers that seemed to reveal the true pulse of the nation.
Contrary to many national averages, the Los Angeles Times Daybreak poll, which sampled voter commitment to both candidates, showed Trump leading Clinton throughout the campaign. Trump's biggest bumps in support, it turns out, came during the Democratic National Convention and after he hired Breitbart's Steve Bannon to run his campaign in August.
The way Trump cut his path to the White House has been topic of analysis by talking heads across the media. One thing that is clear, however, is that the election has shown how wrong polls can be.
Two weeks after the Trump's victory, data about how each county voted gives a stronger, clearer picture of where and how Trump secured the presidency. Clinton's share of the popular vote passed more than 2 million ballots on Wednesday (23 November), making her the first candidate in US history to lose after gaining so much of the vote.
When you see the high levels of support that Trump gathered in areas of the country in comparison to wavering support for Clinton, however, it becomes clear how he won 290 of the Electoral College votes over Clinton's 232. Below we analyse the crucial factors that led to his victory.

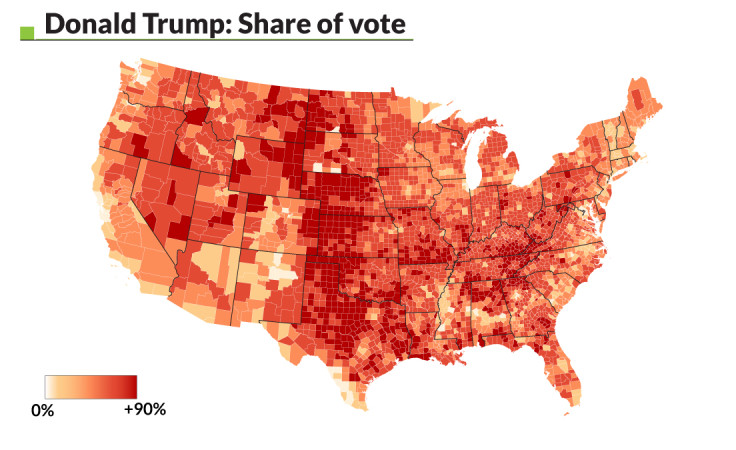
1. Trump tapped into a vein of very committed voters
As the map shows, President-elect Donald Trump conquered county after county with high averages of vote share. The centre of his most fervent support solidified in the midwest. Yet a surprising amount of support emerged in the central eastern states such as Ohio and Pennsylvania, as well as the north-midwest. Trump outperform every other GOP candidate for the presidency in history, with a total of more than 61 million votes.
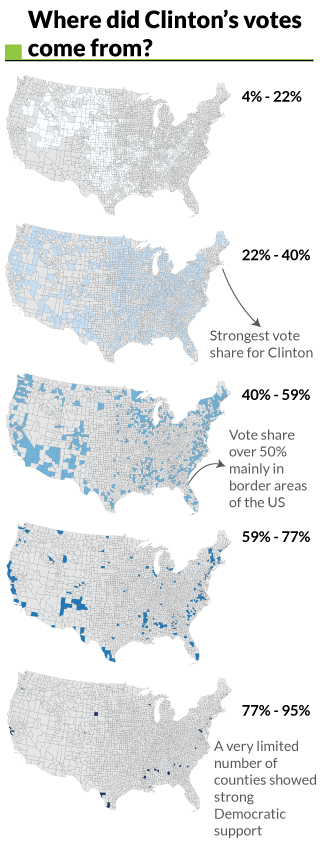
2. Clinton not as strong as first thought
Yes, Clinton won the popular vote, but as this map shows, people's preference for her wasn't uniform across the country. Most of the states wavered in their conviction that she was fit to be president after a new FBI enquiry hit her campaign in the week preceding the election. Many states in the north and south east that voted for her husband, Bill Clinton, in 1996 — as well as Barack Obama — simply weren't won over.

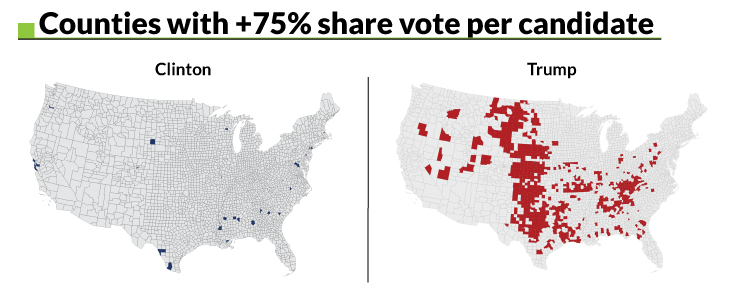
3. Where Trump won and Where Clinton lost
Where did each of the candidates registered the highest support?
An analysis of the result county-by-county shows Trump won in a considerable number of counties by a very high margin, tapping into more than 75% support in many more places than Clinton. The reality is that fewer precincts showed overwhelming support for the Democratic candidate. That was unexpected given national polling data that showed her with slim advantages in the popular vote.

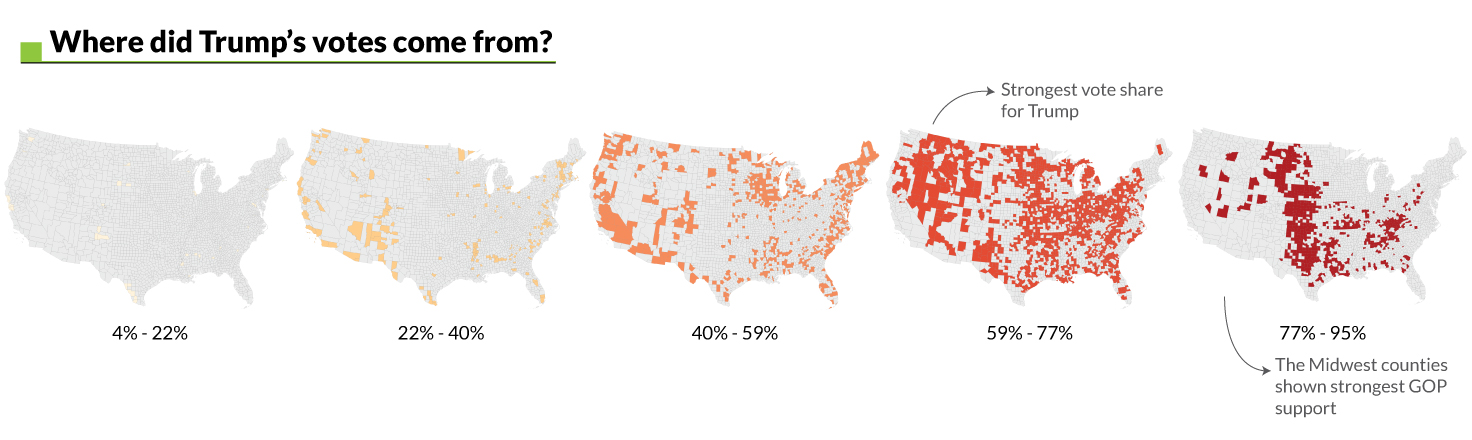
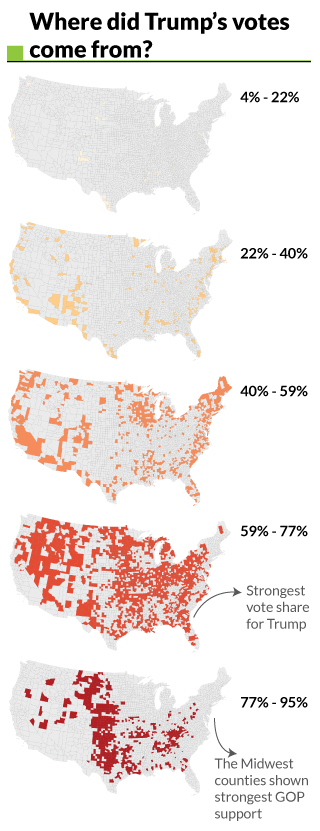
4. Trump votes and their origin
Breaking down the voting results available now it is possible to visualise different patterns to better understand where Trump rallied the most voters. Counties that registered 59-77% support for Trump – meaning a medium-high support for the GOP – are spread across all the US, including in areas typically dominated by Democrats. Many suburbs and medium-size cities are represented in this category.
Counties located in the margins of the United States showed a medium amount of support for Trump. But even this means a 40% to 59% share of the vote for in places where many were expecting stronger numbers for Clinton.
5. Clinton won in the most populated area
Votes for Clinton are spread across the lower percentage classes of the vote share, but emerge in areas with high population density. This is the main reason driving her strong victory in the popular vote, the highest victory by a non-elected president. High-density areas show support between 40 to 59% and 59 to 77%. However, this was not enough to narrow the gap in Electoral College votes with Donald Trump. The Democratic candidate saw a very low number of counties give her a major victory, while a high number show her support at lower than 40%.

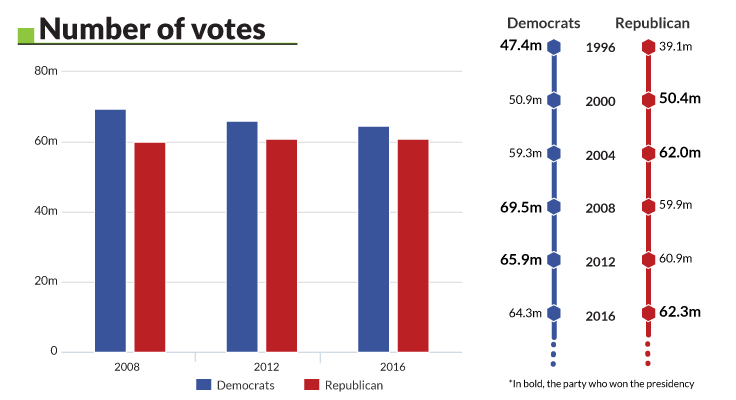
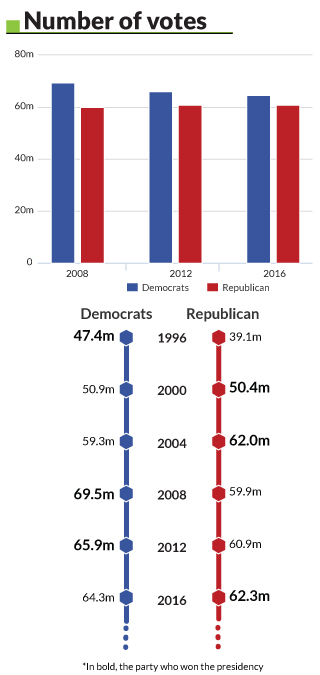
6. Did the Democrats or Republicans grow their base?
The next two charts bust myths that emerged in the election fallout regarding the number of voters decreasing and Clinton losing votes.
However, we can spot a pattern. Over time Democrats are seeing a slight decrease in their voting base. Meanwhile, the Republican party shows steady political growth since 2000, with Trump becoming both the most popular Republican Primary nominee and the most voted-for Republican presidential candidate. This provides evidence that Republicans gained more support among non-voters or undecided voters.
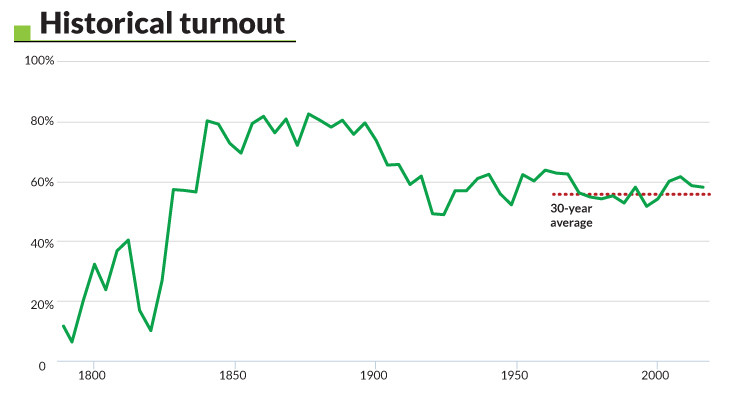
7. Did the voters turn out?
Contrary to reports, voter turnout did not decline from previous years and is in line with 30-year averages. In the immediate aftermath of the election, early numbers suggested that Clinton's defeat was driven by a low turnout. Some suggested turnout had fallen by as much as 5.6%. However, the final data shows the real numbers. Approximately 58.4% of eligible voters cast ballots in the election. Data from the US Election Project, run by University of Florida professor Michael McDonald, shows the turnout is just 0.2% lower than it was in 2012.
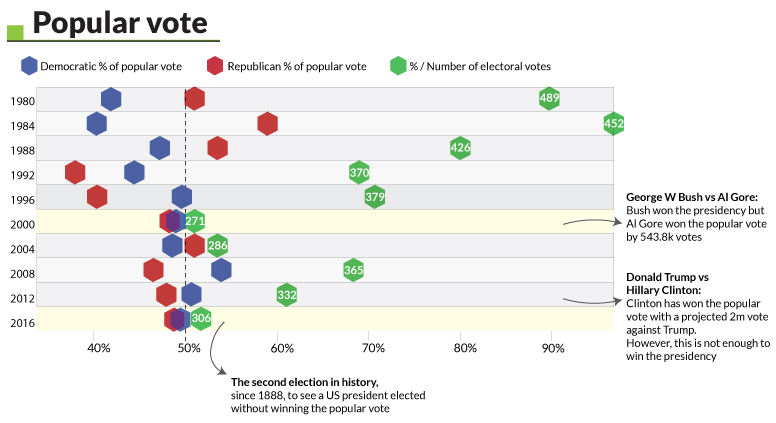
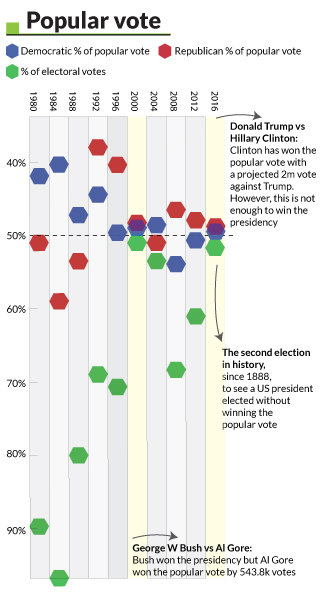
8. Popular Vote vs Electoral College
The 2016 US presidential election has seen, for the second time since 1888 (the first was in 2000), a candidate who won the presidency without getting highest number of popular votes. Voters in the US do not directly elect the president but instead vote for an 'elector' in the Electoral College who has announced in advance how they plan to vote. Gaining at least 270 of the 538 total electoral votes secures the presidency.
In 2000 George W Bush won the presidency, but Al Gore won the popular vote by a 543,800 margin. In 2016 the gap is much larger as Clinton took 2 million more votes than Trump. These results may be due to the polarisation of American voters.
The Pew Research centre has conducted research showing that the positions of party supporters are increasingly diverging along ideological lines. In the past, voters were more likely to swap parties from one election to another. In recent years this has changed. As a consequence the differences in popular vote and presidency are, and will become, more common in coming years.
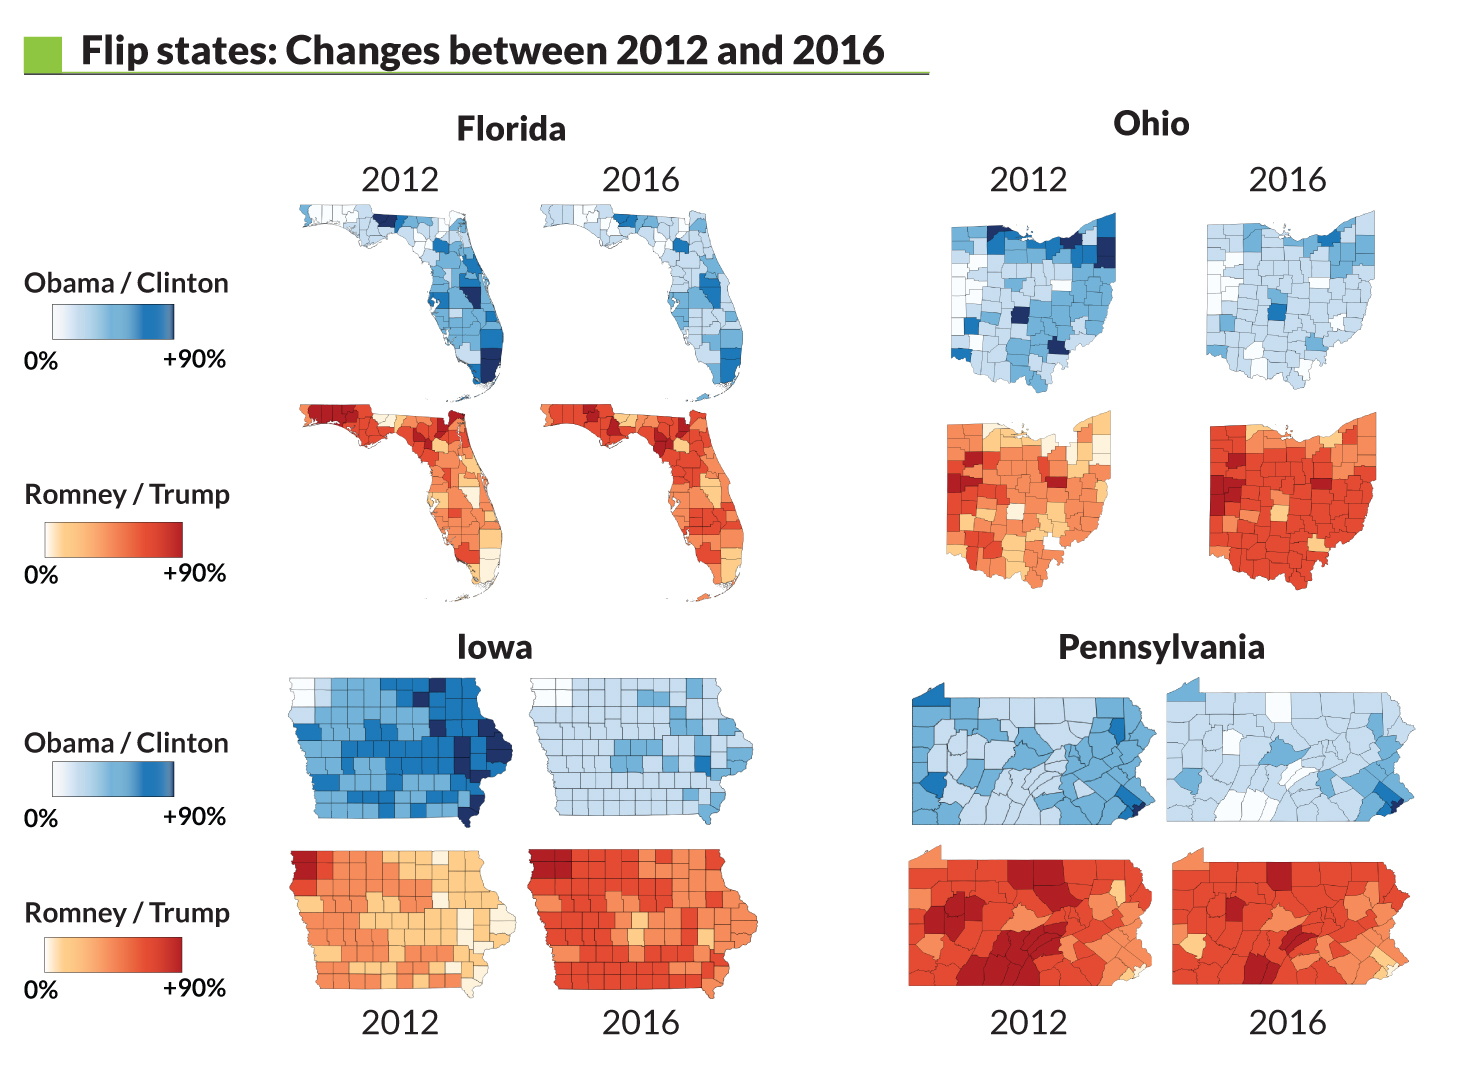
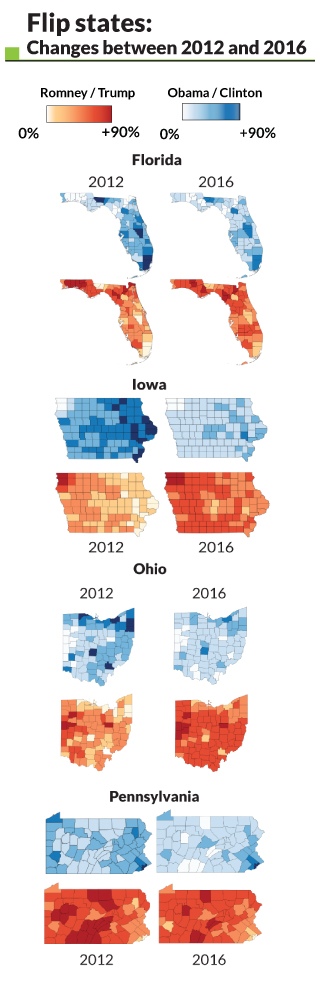
9. Flip states and their changes
Florida, Iowa, Pennsylvania and Ohio were decisive for the Trump victory. Trump was able to over-perform in Florida and Pennsylvania. The differences from Mitt Romney's results in 2012 are evident, with counties showing much stronger Republican support. Hillary Clinton failed all attempts to convince the four swing states, with some areas giving her less than a 15% share of the vote.
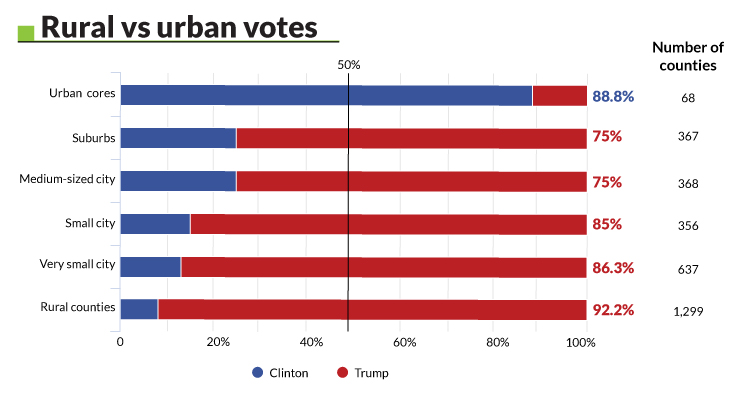
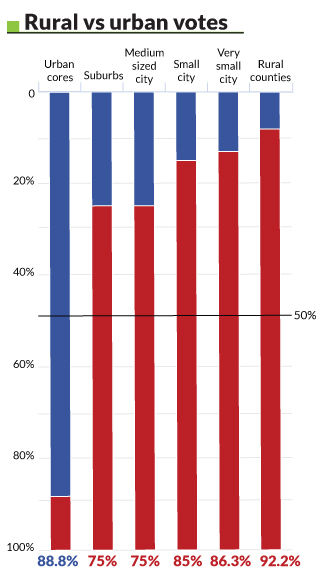
10. Urban vs Rural
Despite being a businessman with properties in large American cities, Trump completely failed in America's urban centres. Clinton, on the other hand, didn't do well in suburbs and medium-sized cities. This election makes evident political forces are breaking from the traditional American urban-rural divide. On one side we now see big, rich cities and on the other suburbs and rural counties that are still trying to recover from the financial crisis.
Methodology
Sources: US Election Project, Dave Leip's Atlas of US Presidential Elections, RealClearPolitics, Federal Election Commission, US Census, IBT Research.
Division of urban and rural areas have been made following the definition provided by the US Census website.
© Copyright IBTimes 2025. All rights reserved.
- MOST POPULAR IN Politics


