

UK housing: Asking prices hit record high amid first-time seller surge

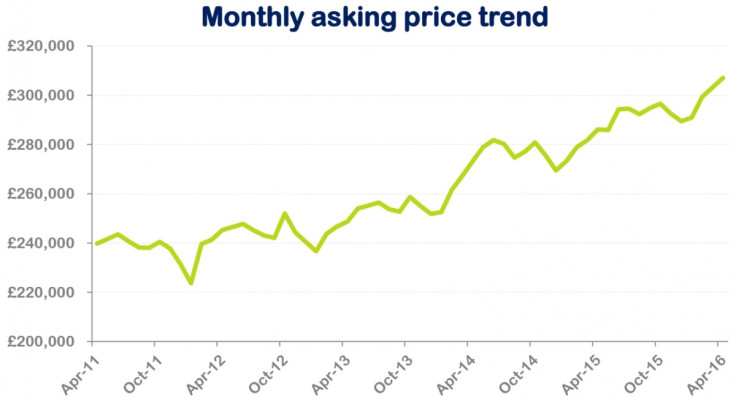
The average asking price for a home coming onto the property market hit a record high at the beginning of April, said the listings website Rightmove. Its house price index for April 2016 said the average asking price in England hit £307,033 after a 7.3% annual rise.
This is because of a rush of buy-to-let investors who flooded the market to beat a stamp duty hike by Chancellor George Osborne on 1 April, which had been announced in November. Osborne added a 3% levy on top of basic stamp duty rates for purchases of additional property. Buy-to-let investors were in fierce competition to snap up properties before the new tax year, driving up prices.
The number of days it took for a property to sell fell to its lowest in more than a year in March, at 62, said Rightmove. This is also ten days fewer than the same month a year before. An ongoing housing shortage in some areas of the country, particularly London and the South East, is pushing up house prices. House building is running at around half the level needed to meet demand.
Many of those selling to buy-to-let investors were first-time sellers looking to trade up, said Miles Shipside, Rightmove director and housing market analyst. "They used the heightened demand from investors competing fiercely with first-time buyers to springboard themselves onto the next rung of the housing ladder," he said.
"After several years of being held back from moving by post-credit-crunch price doldrums, they have now benefited from a heady combination of price growth, historically cheap interest rates, and confidence of a quick sale with purchasers working to a tight deadline. Trader-uppers have now been unleashed and this has spread demand upwards and helped to form longer chains."
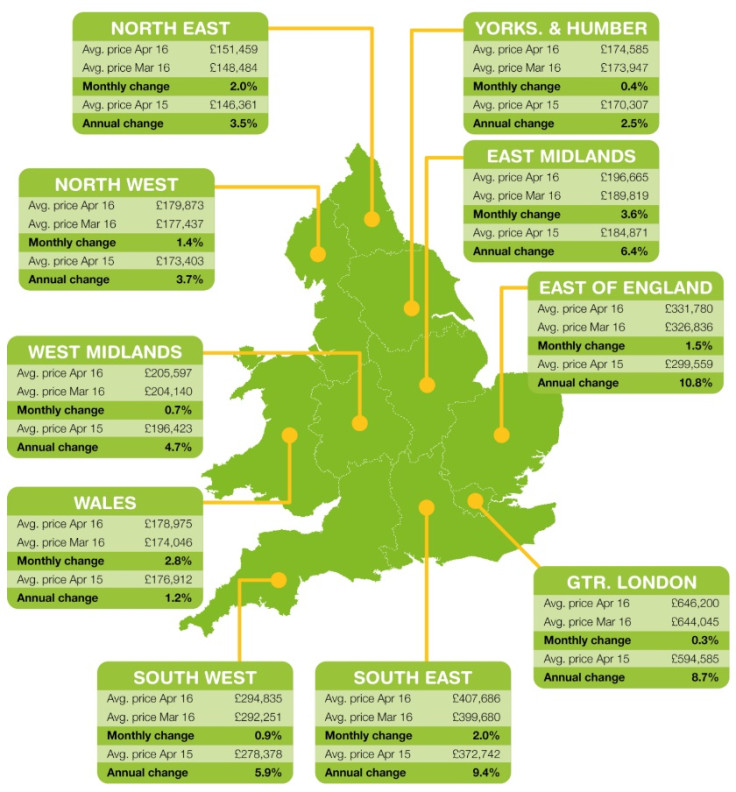
Asking prices grew fastest in the East of England, where the average rose 10.8% over the year to £331,780. Next fastest was the South East with a 9.4% increase to an average asking price of £407,686. In London, where prices are highest, the average grew 8.7% to £646,200.
Within London, there is rapid house price growth in outer boroughs as more people are priced out of the centre and investors look for higher returns from cheaper property. Prices are growing more quickly in Barking and Dagenham than any other borough; the average asking price shot up 23% over the year to £302,347. By comparison, in Kensington and Chelsea, where prices are highest in the city, the average asking price fell by 12.8% to £2,244,739.
Rightmove: London's average asking prices by borough
| Borough | April 2016 average price | Annual change (%) | Monthly change (%) |
| Barking and Dagenham | £302,347 | 23.00% | 1.60% |
| Greenwich | £485,697 | 21.40% | 8.50% |
| Redbridge | £449,125 | 18.30% | -0.40% |
| Harrow | £570,481 | 18.20% | 1.70% |
| Waltham Forest | £464,824 | 16.80% | 0.80% |
| Richmond upon Thames | £933,761 | 15.90% | 1.10% |
| Havering | £389,583 | 15.90% | 2.10% |
| Hounslow | £583,015 | 15.70% | 5.00% |
| Sutton | £439,576 | 15.50% | 1.20% |
| Bexley | £356,208 | 15.10% | 0.60% |
| Newham | £401,197 | 14.20% | 0.00% |
| Hillingdon | £490,183 | 13.90% | 2.40% |
| Croydon | £416,889 | 13.40% | 2.90% |
| Camden | £1,150,149 | 12.40% | -0.30% |
| Merton | £671,176 | 12.00% | -0.80% |
| Wandsworth | £852,058 | 11.80% | -1.80% |
| Lewisham | £467,182 | 11.40% | 2.70% |
| Enfield | £463,804 | 10.60% | 3.50% |
| Bromley | £541,610 | 10.30% | -0.10% |
| Brent | £631,089 | 9.90% | 0.70% |
| Barnet | £702,956 | 9.00% | -2.00% |
| Islington | £790,552 | 7.60% | -4.40% |
| Haringey | £604,138 | 7.50% | -5.40% |
| Lambeth | £664,561 | 7.30% | 3.30% |
| Kingston upon Thames | £637,544 | 6.10% | -0.60% |
| Hackney | £639,876 | 4.40% | -3.50% |
| Hammersmith and Fulham | £1,057,044 | 3.80% | 3.30% |
| Ealing | £625,473 | 3.10% | 0.70% |
| Southwark | £657,370 | 1.00% | -0.30% |
| Tower Hamlets | £600,705 | -2.80% | 2.10% |
| City of Westminster | £1,880,224 | -3.10% | -1.40% |
| Kensington and Chelsea | £2,244,739 | -12.80% | -4.50% |
© Copyright IBTimes 2025. All rights reserved.
- MOST POPULAR IN Property


