Video Shows Six Decades of Intense Global Warming [VIDEO]
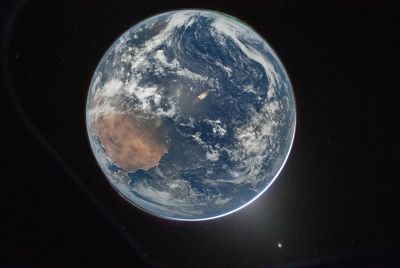
A recent graphic of Earth released by Nasa shows the intensity of global warming from 1950 to 2013.
The visualisation released by Nasa's Goddard Institute for Space Studies (GISS) in New York, which analyses global surface temperatures on an ongoing basis, depicts the increasing global warming on Earth decade on decade for the last six decades.
Scientists say 2013 tied with 2009 and 2006 for the seventh warmest year since 1880, continuing a long-term trend of rising global temperatures, while 2005 and 2010 were the warmest years in the last decade.
"With the exception of 1998, the 10 warmest years in the 134-year record all have occurred since 2000, with 2010 and 2005 ranking as the warmest years on record," Nasa said in a statement.
The average temperature in 2013 was 58.3 degrees F (14.6 C), which is 1.1 F (0.6 C) warmer than the mid-20th century baseline, according to scientists.
GISS' analysis shows that the average global temperature has risen about 1.4 degrees F (0.8 C) since 1880.
"Long-term trends in surface temperatures are unusual and 2013 adds to the evidence for ongoing climate change," GISS climatologist Gavin Schmidt said.
"While one year or one season can be affected by random weather events, this analysis shows the necessity for continued, long-term monitoring."
Scientists believe that despite weather patterns that will always cause fluctuations in average temperature, it is the continued increase in the emission of green house gases that is causing long-term rise in global temperature.
The GISS' video shows comparison in temperatures of 60 years and how Earth continues to experience warmer temperatures than several decades ago.
Watch the video below:
© Copyright IBTimes 2025. All rights reserved.
- MOST POPULAR IN Science