

Chart in Focus: Britons Get Poorer as UK Tumbles Down World Disposable Income Rankings

We all knew it, but here is definitive proof - in chart form - that Britons are getting poorer in comparison to our wealthy friends across the world.
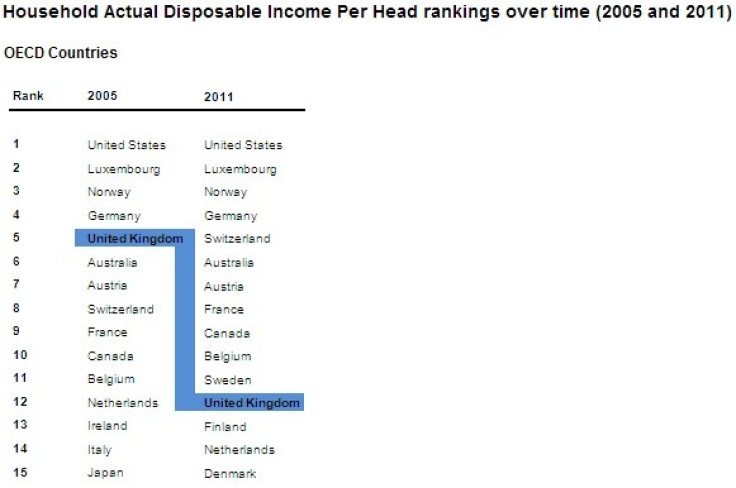
The Office for National Statistics (ONS) revealed that between 2005 and 2011 the UK fell seven places in the world league table for disposable income per head:
Why? Well the financial crisis was a bit of a hiccup. Since then, in the economic scramble toward a comprehensive (and still elusive) recovery from the crisis, inflation has soared and wage growth has stalled.
As a result, wages are now at similar levels to a decade ago. The cost of living is going up all the time, with energy, food and transport bills all rising way ahead of pay.
Inflation has been above the government's 2% target since December 2009 as volatile commodity prices cause havoc.
In February, wages grew at just 1% - the slowest rate since ONS records began in 2001.
Research by the Trades Union Congress found that the lowest paid workers are four times worse off from the increase in VAT to 20% in January 2011 than what they will receive back as the personal allowance tax threshold rises to £10,000 in 2014.
Underemployment - those not working enough hours to satisfy their needs - has soared by 1m since the financial crisis.
It will take a long time for the UK to climb back up the disposable income rankings - if at all.
© Copyright IBTimes 2024. All rights reserved.
-

Doug McMillon Unloaded Walmart Trucks For $6.50/Hour In 1984, Now He's The CEO
-

How Are Female Tech Firms Fighting the Employment Crisis in the West Bank?
-

Italian PM Has British Newborn With Heart Defects Airlifted to Rome for Treatment Unavailable in UK
-

Sugar Baby Gets 9 Years In Jail For Scamming $1M From Men And Selling How-to Manuals


