AUD/USD Rallies to Near Seven-month High on Chinese Data, AUD/USD Testing Key Resistance


The Australian dollar rallied to a near seven-month high against the US dollar on 23 June after better-than-expected Chinese PMI data increased the demand outlook for Australian exports.
The AUD/USD traded as high as 0.9446, from its previous close of 0.9389. It is the highest since 7 November last year on a closing basis although the pair had traded above that intra-day on 10 April.
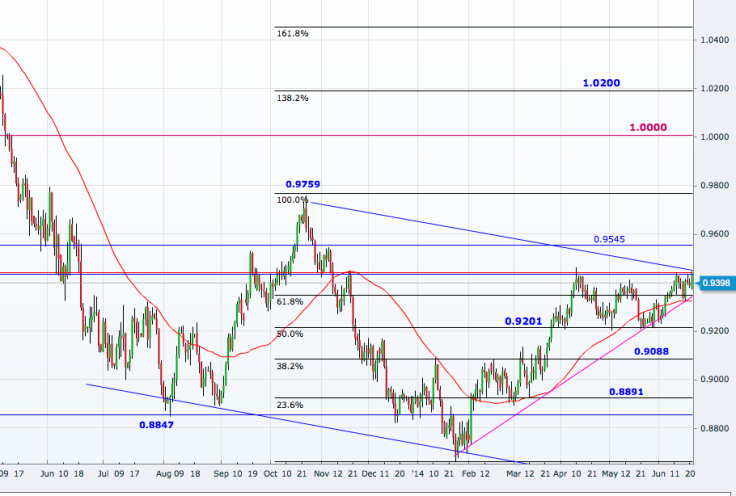
The formation of a "wedge pattern"- one with higher lows and steady highs - on a daily chart since 24 January seems to have neared its breakout level.
An upside break will expose 0.9463, the intra-day peak on 10 April, and then aim 0.9545 ahead of 0.9733, the October 2013 peak.
It is an important one as a break of that will open the doors to the psychologically significant parity level.
The daily chart shows 0.9320 as the first support, slightly below where the pair halted its drop after the Chinese data. That level is supported by the 61.8% retracement of the October 2013 to January 2014 downtrend and the 50-day moving average.
The next level is 0.9201, the 50% mark, and then comes 0.9088 and 0.8891, the 38.2% and 23.6% levels.
Broader Picture
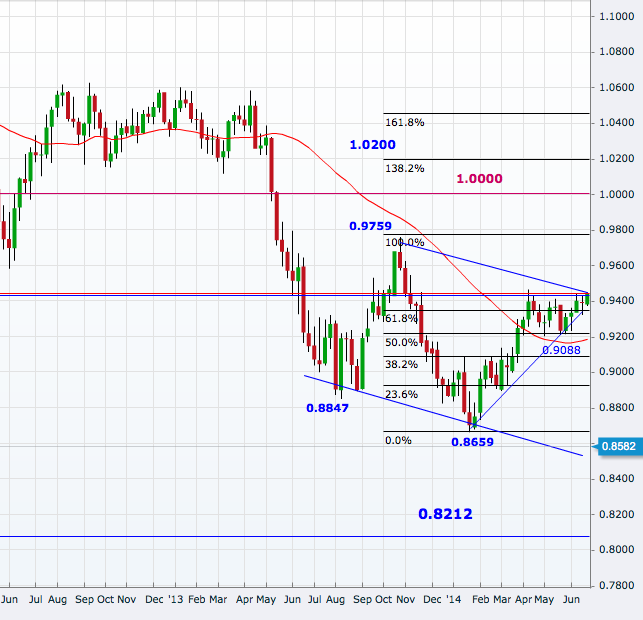
On the weekly chart, the pair is still holding a downtrend but the fact that it is currently testing the upside barrier of the channel should be more significant.
On the downside, the 0.8891-8847 area is a significant support zone for the pair, break of which will confirm resumption of the downtrend and then target 0.8650 ahead of 0.8500, where it may hit channel support.
On the higher side, levels on the daily chart are crucial for weekly chart too. Above parity, the AUD/USD will target 1.02, the 138.2% retracement of the October 2013 to January 2014 downtrend.
© Copyright IBTimes 2025. All rights reserved.
- MOST POPULAR IN Forex