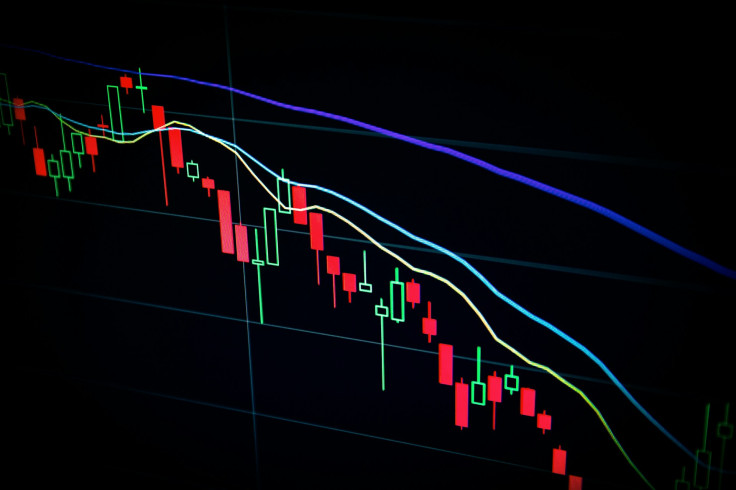
XRP Momentum Fades — What Falling RSI Means for Traders
A falling RSI often suggests the start of a correction or trend reversal

XRP's latest price action is drawing scrutiny, as its Relative Strength Index (RSI) suggests a drop in market momentum. While the $3 level remains a key threshold amid legal and regulatory developments, a declining RSI may indicate that the rally is losing steam and traders are watching closely.
Despite institutional interest and ETF talk providing tailwinds, technical signals now raise questions about whether bulls still have the upper hand.
What is the RSI Saying?
The RSI is a momentum oscillator that gauges the speed and magnitude of recent price movements, plotted on a scale of 0 to 100. Levels above 70 traditionally indicate overbought conditions, while readings below 30 suggest oversold territory, the TradingView explained.
A falling RSI, especially from overbought territory, implies a loss of bullish momentum, potentially marking early signs of a price correction or trend reversal.
XRP's RSI Shows Signs of Weakness
XRP briefly approached $3.10 this summer before stalling, and the RSI has since fallen back into more neutral territory, around 59, after previously sitting well above 70, according to Yellow. This dip aligns with resistance near $3.40 and underscores a potential shift in sentiment.
Meanwhile, on shorter timeframes, analysts have spotted bullish RSI divergence, where price holds steady but RSI strengthens, suggesting that selling pressure may be easing, CryptoRank reported. These technical nuances underscore the thin line between consolidation and correction.
🚨 XRP Clears $2.96 R. Watching $3.02–$3.04 for Support Before Next Wave! 🚨$XRP has made a decisive move by breaking above the key Fibonacci level at $2.96. This support has held firm for nearly a day. We've also seen a clean backtest of that level, helping us confirm its… pic.twitter.com/gxVNM1XpUi
— CasiTrades 🔥 (@CasiTrades) August 7, 2025
What This Means for Traders
Traders watching RSI trends may draw several conclusions. Firstly, falling RSI suggests that bullish momentum is weakening, according to Crypto Economy. Even as XRP remains near the $3 mark, this slowdown could lead to a short-term retracement, especially if trading volume declines.
Secondly, if XRP's price continues to rise while RSI fails to follow, this divergence is often an early warning of a potential correction. Recognising such a pattern can help traders adjust their positions, Rajeev Prakash reported.
Finally, traders using RSI in strategy development might opt to tighten stop-losses or reduce exposure to long positions if the indicator continues to drop, according to The Economic Times. Support levels between $2.92 and $3.00 could offer a potential rebound zone, particularly if RSI begins to recover.
Context from the Broader Market
XRP's momentum must be interpreted within a wider trading environment. Recent whale activity, such as a $1.9 billion token sell-off, has added volatility even as clarity in Ripple's legal proceedings fosters cautious optimism, according to Binance. Additionally, technical charts show resistance zones hovering between $3.02 and $3.10, with support near $2.92, reinforcing the importance of those levels in coming days, Mitrade reported.
Historically, XRP has shown high sensitivity to both legal outcomes and broader crypto market sentiment, AInvest reported. Comparisons with Ethereum's and Bitcoin's RSI patterns suggest that XRP often lags slightly behind in momentum shifts, offering a brief window for tactical repositioning.
XRP's inability to sustain advances above $3, supported by waning RSI momentum, calls for caution. A decline in RSI doesn't inherently signal a collapse, but it does warn that the bullish push may be faltering. As traders navigate an uncertain market, RSI readings remain a key tool for timing entries and exits, especially near historically significant price thresholds.
© Copyright IBTimes 2025. All rights reserved.


