Gold and Silver Remain Strong Amid Geopolitical Concerns as Speculators Increase Buy Positions


Gold and silver have pared some of their recent gains since Monday, but rising geopolitical tensions have held the commodities above the 50-day moving average supports with speculators' buy-bets rallying to new highs.
Speculators' net buy positions rose to an 18-month high of 150,021 in gold in the second week of July, before easing slightly in the last week, the Commodity Futures Trading Commission's (CFTC) latest commitment of trade (COT) data showed.
The positions have rocketed to a four-year high of 49,278 in silver in the last week, 2.7 times over a month, according to the CFTC.
Gold for spot delivery dropped to $1306.70 on Tuesday from Monday's close of $1312.17, but more than 1% stronger than the one-month low of $1291.50 touched on 15 July.
Silver slipped to $20.79 from $20.89, but stayed more than 2% stronger from the 17 July low.
The ongoing Israel-Gaza conflict and the threat of increased sanctions on Russia after the Malaysian jet MH17 was shot down by Russia-backed rebels in Ukraine have been keeping investors attracted to safer assets like precious metals and the dollar over the past two weeks.
Both gold and silver have been successful in holding comfortably above the 50-day simple moving average (SMA), indicating the technical strength of the metals.
The 50-day SMA stood at $20.24 for silver and $1294.09 for gold at 6:21 GMT.
The dollar's performance this week will also depend on upcoming releases including the consumer price inflation, Markit manufacturing PMI and durable goods orders, in addition to the weekly jobless claims data.
Whether or not this week's numbers support the hawkish elements, the recent Fed remarks are likely to impact the greenback, and therefore, will be important for the metals as well.
But the evolution of the Ukraine crisis and how it will affect the Russian oil trade as well as foreign businesses in Russia will be more crucial for gold and silver.
Technical Outlook
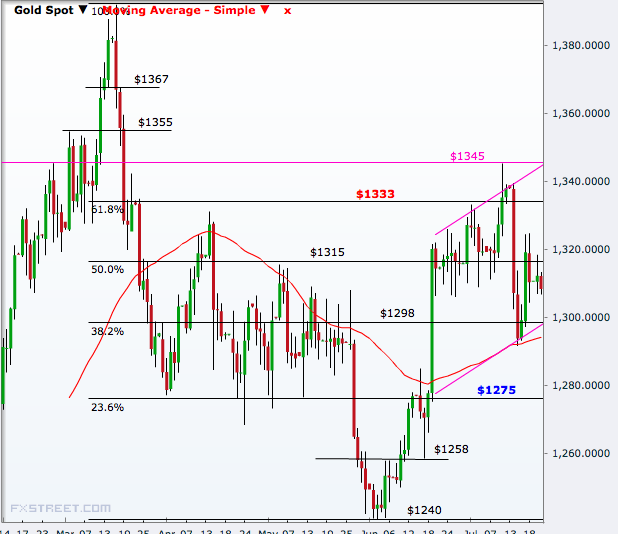
The mid-July rebound after the failure of a higher side "flag break" in the gold daily chart has been shaping a new upward channel with a downside barrier around $1300 and upside near $1345.
The yellow metal has first main resistance at $1333, the 61.8% Fibonacci retracement of the March-June selloff. Then come $1345 and $1355 ahead of a retest of the 17 March peak of $1392.
On the downside, the 38.2% mark of $1298 remains a strong support, a break of which will weaken the uptrend being formed and take it to $1275 easily.
A break of that will open the doors to a retest of the 3 June low of $1240.20 though $1258 might work as a minor support on the way.
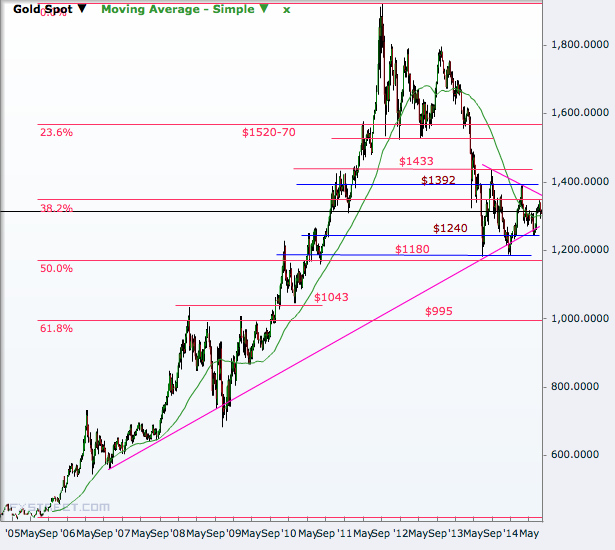
The big picture according to the weekly chart shows that gold is forming an isosceles triangle pattern with the vertex angle around $1300 and the base line between $1180 and $1430.
A break above will open the doors to $1520-70 ahead of $1780. On the downside, the support range beyond $1180 is $1040-$995.
© Copyright IBTimes 2025. All rights reserved.
- MOST POPULAR IN Gold