How low below 6000 will FTSE 100 go in 2014?

The FTSE 100 has had a turbulent year - losses since September are set to end the index in 2014, breaking a two-year streak of gains.
However, the index has managed to hold around the channel support of the upward trend since 2009. The main UK share index was up in the earlier part of the year and it hit a 14-year high of 6900 before losing momentum in the ninth month.
The all-time high was just 30 points away then.
After rallying more than 2% from the 2013 close to this year's peak, the index dropped more than 11% from there to this month's low, translating the yearly performance so far to a 6.2% fall.
The 6% or so fall in 2014 follows the 14% rally in 2013 an 21% rally in 2012.
However, the index still keeps the broad uptrend since 2009. At the September peak this year, it was up more than 55% from 2008 end, and at Tuesday's close, it was still up 42%.
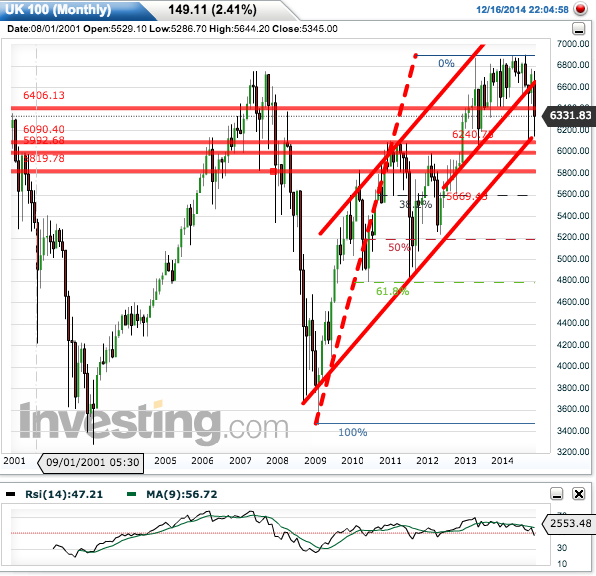
Charts show that the FTSE 100 has upside room within its five-year long upward channel, increasing the likelihood of new highs over the next few months.
However, with momentum indicators pointing to persistent weakness, the index can test new levels below the channel support. The Relative Strength Index (RSI) on the monthly chart has been keeping below the 9-day simple moving average since May last year.
In case of a bounce back inside the channel, the index will immediately aim at 6400 and then 6500 before setting out to new multi-year highs. The 6750 mark is also likely to offer some resistance ahead of a retest of the 2014 peak.
If the index gets under increased downside pressures, it will first target 5990 and then 5820, which seems to be a reasonably strong support.
The 38.2% retracement of the rally since end 2008 to the peak this September that comes at 5600 is the next support.
As long as the 5820 support holds, the index will have more upside risks than on the downside.
© Copyright IBTimes 2025. All rights reserved.
- MOST POPULAR IN Markets