San Francisco's Millennium Tower is sinking by 4cm every year and no one really knows why
Skyscraper at centre of city has been sinking and tilting since it was completed in 2009.

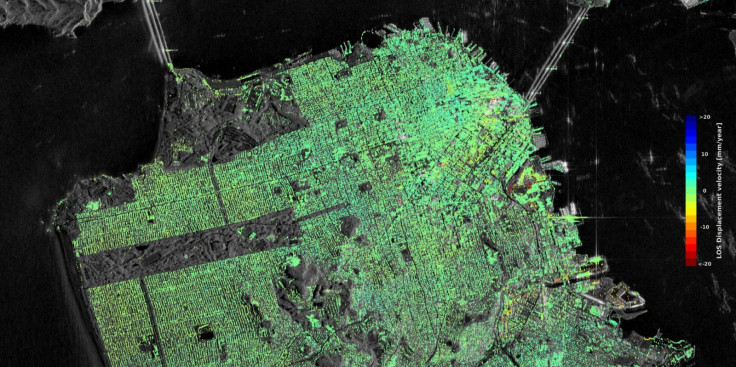
The Millennium Tower in San Francisco is sinking by around four centimetres ever year, satellite data has confirmed. While the reason for the sinking is still not known, data from the ESA's Sentinel 1 satellite shows how the skyscraper has moved since it was completed in 2009.
News the Millennium Tower had tilted and sunk was announced earlier this year. So far, the 58-storey building has sunk some 40cm and tilted 5cm to the north west. The City of San Francisco has now filed a lawsuit against the developers, claiming they knew about the problems but did not disclose the information to prospective homebuyers. Mission Street Developers LLC say the allegations have no merit.
Tracking the changes to the building over time, scientists from the ESA and Norway have now used satellite data to show how the building is moving. They combined radar scans from satellites from the same area to look at subtle surface changes.
Images show the Millennium Tower is sinking by a few centimetres ever year: "Data from the Sentinel-1 satellites acquired between 22 February 2015 and 20 September 2016 show that Millennium Tower in San Francisco is sinking by about 40 mm a year in the 'line of sight' – the direction that the satellite is 'looking' at the building. This translates into a vertical subsidence of almost 50 mm a year, assuming no tilting," the ESA said in a statement.
Scientists are currently working to understand why the building is sinking. They think movements are connected to the supporting piles not resting firmly on bedrock – instead of resting on hard ground, they are resting on weaker soil. This has not been confirmed, however.
Read more:
The San Andreas fault is about to crack – here's what will happen when it does
Another fault has just been discovered running parallel to the San Andreas one
Two of San Francisco's most dangerous fault lines are linked - and that's very bad news
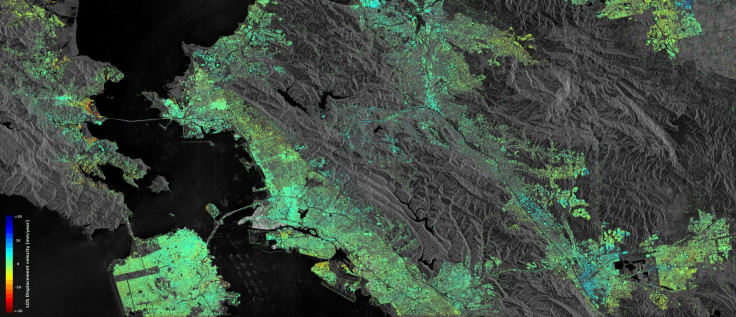
Using the data, researchers were also able to look at "displacement hotspots" over larger areas. This allowed them to find other parts of San Francisco that are subsiding. "These include buildings along the earthquake-prone Hayward Fault, as well as subsidence of the newly reclaimed land in the San Rafael Bay," the ESA said.
Uplift was detected near the city of Pleasanton which was potentially caused by an increase of groundwater – 2015 marked the end of a four-year drought in the region.
Along with showing changes to the San Francisco area, the team can use the findings and apply them to other cities where subsidence is a problem, including Norway where some buildings have started sinking.
"Experience and knowledge gained within the ESA's Scientific Exploitation of Operational Missions programme give us strong confidence that Sentinel-1 will be a highly versatile and reliable platform for operational deformation monitoring in Norway, and worldwide," said John Dehls, from the Geological Survey of Norway.
© Copyright IBTimes 2025. All rights reserved.
- MOST READ