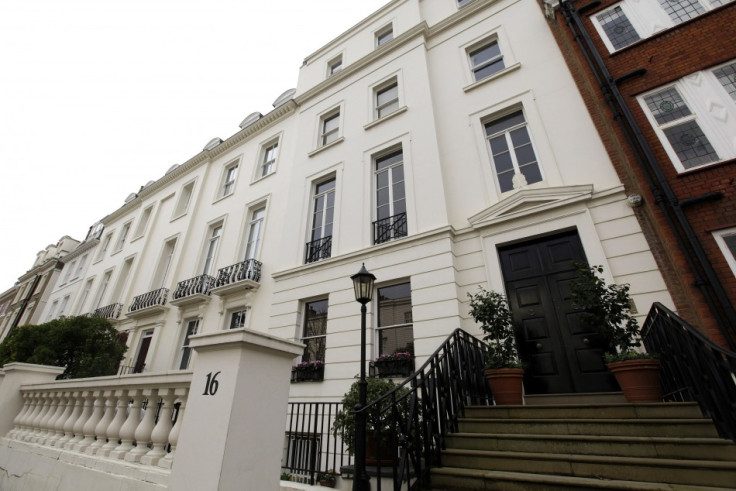
UK house prices: Wealthy London homeowners made £75 an hour doing nothing in 2015

Some of Britain's wealthiest homeowners, in Westminster and Camden, two of London's most expensive boroughs, made £75 an hour in 2015 just by sitting back and letting their property rise in value. That is according to online estate agent eMoov, which analysed data from listings site Zoopla and broke down the average gains in property price across the UK per working hour.
For the whole of London, homeowners made £35 per working hour – Britons work on average 1,677 hours a year – through rising house prices. The city has a serious shortage of housing supply, so prices have accelerated much faster than elsewhere in the country in recent years. Homeowners for the UK as a whole made £16 on average, said eMoov.
"Homeownership is not only one of the biggest decisions in life but also one of, if not the most expensive asset us Brits will ever own," said Russell Quirk, founder and chief executive of eMoov. "However getting over the hump of homeownership and the costs that come with it can certainly pay dividends in the long run, as this research shows.
"London is always going to dominate in terms of property value increase, but even outside of the south east, UK homeowners across the board have enjoyed an increase in property value equivalent to a second salary."
London's top 10 performing areas in 2015
| Location Name | Av House Price 2015 | Av House Price 2016 | £ Change | Change by Week | Average Working Hour | |||||||||||
| Westminster City of | £1,258,255 | £1,383,680 | £125,425 | £2,412 | £75 | |||||||||||
| Camden | £983,162 | £1,108,489 | £125,327 | £2,410 | £75 | |||||||||||
| Islington | £719,152 | £810,827 | £91,675 | £1,763 | £55 | |||||||||||
| Kensington and Chelsea | £2,106,135 | £2,196,866 | £90,731 | £1,745 | £54 | |||||||||||
| Lambeth | £597,929 | £675,758 | £77,829 | £1,497 | £46 | |||||||||||
| Richmond upon Thames | £828,443 | £902,282 | £73,839 | £1,420 | £44 | |||||||||||
| Southwark | £562,806 | £636,062 | £73,256 | £1,409 | £44 | |||||||||||
| Ealing | £521,379 | £588,741 | £67,362 | £1,295 | £40 | |||||||||||
| Merton | £579,567 | £646,126 | £66,559 | £1,280 | £40 | |||||||||||
| Hackney | £536,749 | £602,463 | £65,714 | £1,264 | £39 | |||||||||||
Britain's top performing areas in 2015
| Location Name | 2015 | 2016 | £ Change | Increase By Full Week | Increase By Average Working Hour | ||||||||||
| Sefton | £389,269 | £416,552 | £27,283 | £525 | £16 | ||||||||||
| Solihull | £314,460 | £341,470 | £27,010 | £519 | £16 | ||||||||||
| Trafford | £366,934 | £393,736 | £26,802 | £515 | £16 | ||||||||||
| Southampton | £250,018 | £270,653 | £20,635 | £397 | £12 | ||||||||||
| Northampton | £214,281 | £234,448 | £20,167 | £388 | £12 | ||||||||||
| Bristol | £262,706 | £282,314 | £19,608 | £377 | £12 | ||||||||||
| Wiltshire | £256,869 | £276,395 | £19,526 | £376 | £12 | ||||||||||
| Wigan | £144,223 | £158,655 | £14,432 | £278 | £9 | ||||||||||
| Cornwall | £241,105 | £255,517 | £14,412 | £277 | £9 | ||||||||||
| Wirral | £203,706 | £217,816 | £14,110 | £271 | £8 | ||||||||||
© Copyright IBTimes 2025. All rights reserved.


