Yen Slumps to Six-Year Low on Weak Producer Prices and Machinery Orders Data


The Japanese yen has plunged to a six-year low on Wednesday as data showed the corporate goods price index fell in August and machinery orders growth slowed in July, adding to the negative sentiment after the big downside surprise in the GDP data on Monday.
The Bank of Japan data on 10 September showed the producer price index fell 0.2% from the previous month. The machinery orders growth dropped to 3.9% in July from 8.8% in June while analysts were expecting 4% growth.
USD/JPY soared to 106.57, its highest since September 2008, and from the previous close of 105.09. The pair had broken the resistance barrier of 105.46 on Tuesday to a six-year high, but failed to close above the mark.
With the jump in the pair on Wednesday, the yen is the second worst performer among majors after the Australian dollar, so far in the week. The Japanese unit is down 1.3% from Friday's close while the Aussie dollar has fallen more than 2.3%.
Japan Contracts
The Japanese economy contracted 1.8% in the three months to June on a quarter-on-quarter basis, according to the second estimate published on Monday. The new figure came below a preliminary estimate of a 1.7%.
On an annualised basis, the world's third-largest economy shrank 7.1%, much weaker than the preliminary estimate of 6.8% and following a 6.1% expansion in the previous quarter.
It was the April sales tax hike that took a heavy toll on household spending in Japan while business investment fell more than double the first estimate.
The Bank of Japan on 4 September left the main rate at 0% and the pace of expansion of the monetary base at 60-70 trn yen. The central bank said it expects the trend of moderate recovery to continue but cited some weakness in housing investment, industrial production and exports.
The Economy Watchers Survey released on 8 September showed the index decreasing to 47.40 in August from 51.30 in July.
The consumer confidence index for August came in at 41.2 from 41.5 in July while the consensus was for an increase to 42.3.
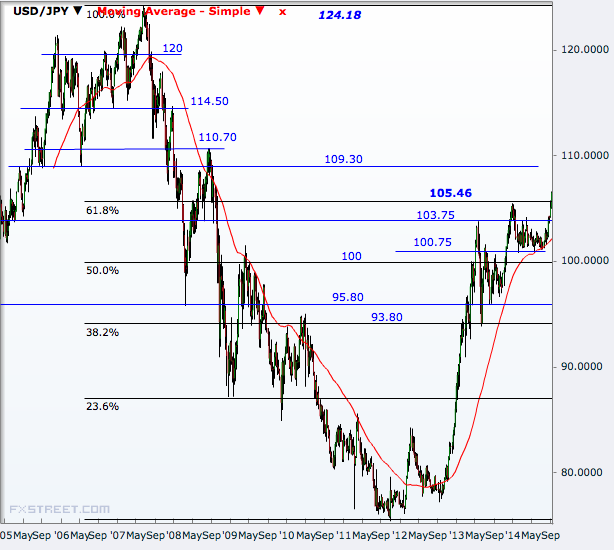
USD/JPY Technical Analysis
With the recent surge, the pair has broken above the 61.8% Fibonacci retracement of the 2007-2011 selloff and now seems headed to the 120 mark.
On the way higher, 109.30, 110.70 are the two important levels to watch ahead of 114.50. A break of that will take the pair to the 120 mark and then a retest of the 2007 peak of 124.2 will be easier.
On the downside, USD/JPY will first target 103.75 ahead of 100.75 before breaking below the 50% Fibonacci at 100.0. A break of that will expose 95.80 and then 93.80 the 38.2% Fibonacci level.
A break of that will reverse the uptrend since 2011 and levels below 90 and even 80 will be the next targets. The 2011 trough was 75.30.
© Copyright IBTimes 2025. All rights reserved.
- MOST POPULAR IN Forex