Crude Oil Technicals: Prices Drop as Iraq Worries Ease But Yet to Reverse Uptrend


The fall of crude oil from its nine-month high has not yet proved a reversal of the trend level-wise but some of the technical indicators do suggest the end of the current uptrend, at least for the short term.
Brent crude for August delivery dropped to a six-day low of $113.52 on 24 June, extending the previous day's losses and after touching a high of $115.67 on 19 June. It was its highest level since 9 September, 2013.
Crude prices cooled as worries that the Iraq crisis would hit oil supply from the country were eased by the actual outflow numbers.
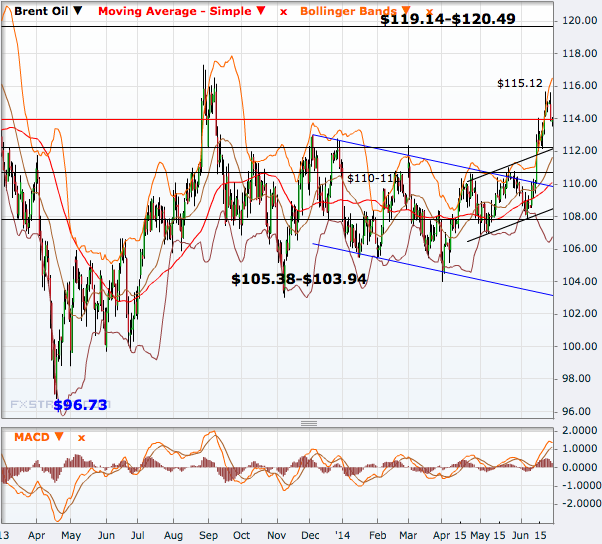
Technical indicators MACD (Moving Average Convergence Divergence) and Bollinger Bands show trend reversal on a daily chart, exposing $112.13 immediately.
A break of that will significantly weaken the uptrend following the Iraq issue but a breach of the $110.61-$111 area is necessary before getting mindful of resumption of the downtrend since March 2013.
That downtrend will bring the $107.75-$106.83 area as the next support zone and then $105.38-$103.94 before hitting the channel support somewhere near $103.0.
On the higher side, the first level to watch out for is $115.67 and then comes $117.31, the August 2013 high. A break of that will take the commodity to its highest level since February last year and open the doors to $119.14, the 8 February, 2013 high.
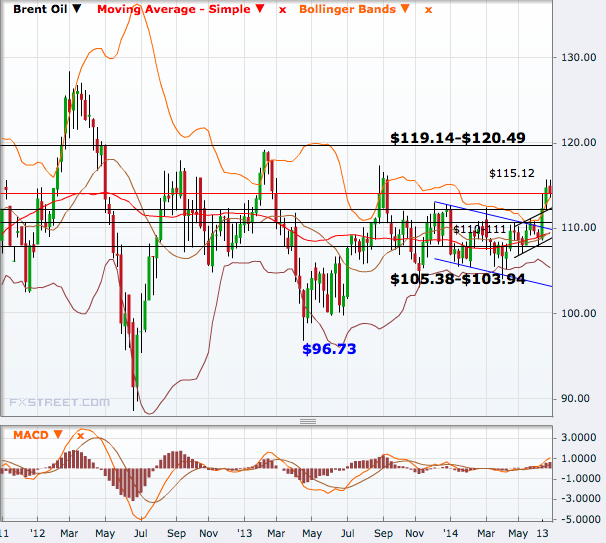
In a weekly chart, Brent is still holding an upward wedge pattern - one characterised by higher lows and steady lows - and is currently testing a key resistance area of $115-$120.
© Copyright IBTimes 2025. All rights reserved.
- MOST READ