Here's what the visible universe looks like – scientists produce map of 3 billion space objects
The most detailed map of the visible universe shows stars and galaxies from the Milky Way to distant quasars.

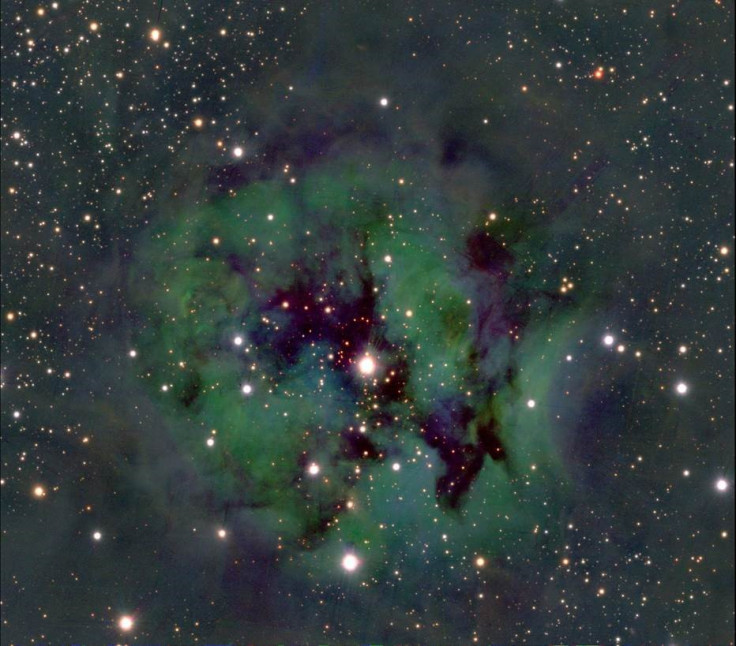
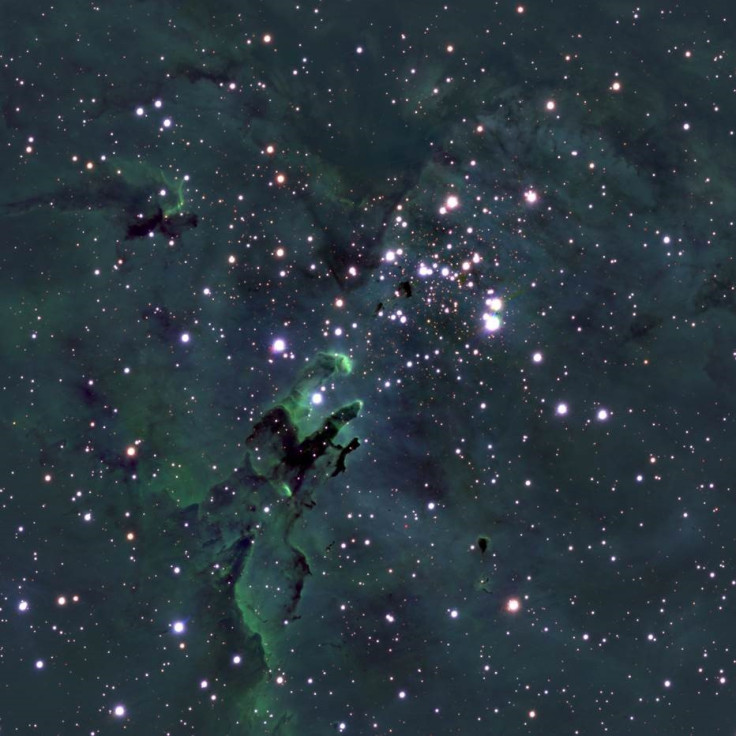
Billions of stars and galaxies have been mapped as part of the most ambitious effort yet to map the visible universe.
The universe is constantly changing, but the Pan-STARRS map now shows the average position, brightness and colour of 3 billion objects in space.
The map contains more than 3 billion separate space objects. It shows our home galaxy, the Milky Way, in a level of detail never achieved before, says Hans-Walter Rix, director of the Galaxies and Cosmology department of the Max Planck Institute for Astronomy in Germany.
"The survey provides, for the first time, a deep and global view of a significant fraction of the Milky Way plane and disk – an area usually avoided by surveys given the complexity of mapping these dense and dusty regions," Rix says.
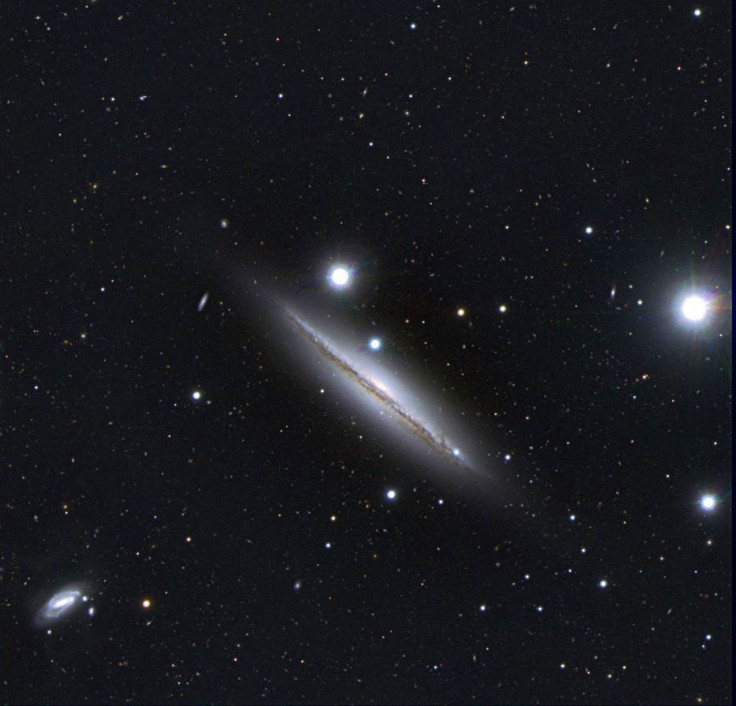
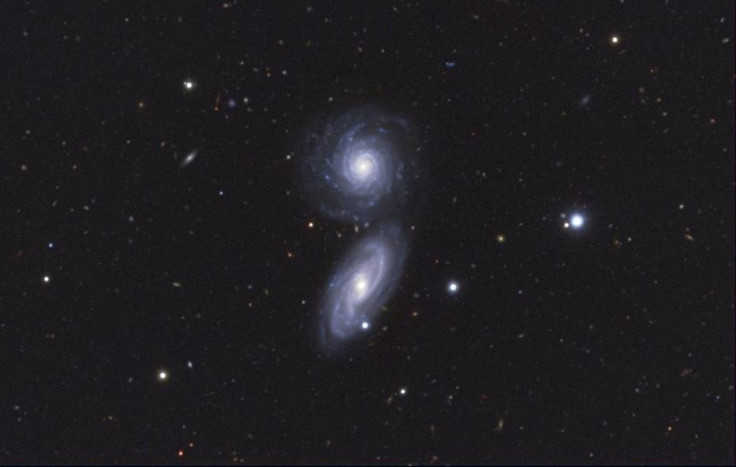
Outside our galaxy, our nearest neighbour – the Andromeda galaxy – is also closely scrutinised. Data from the map have allowed researchers to hone down exactly how much dark matter there is in the galaxy.
Further afield, the map also covers the most distant observed quasars, mapping how far away they are, their size and their colour. These quasars are important in forming the earliest evidence in our universe of giant black holes at the centres of galaxies.
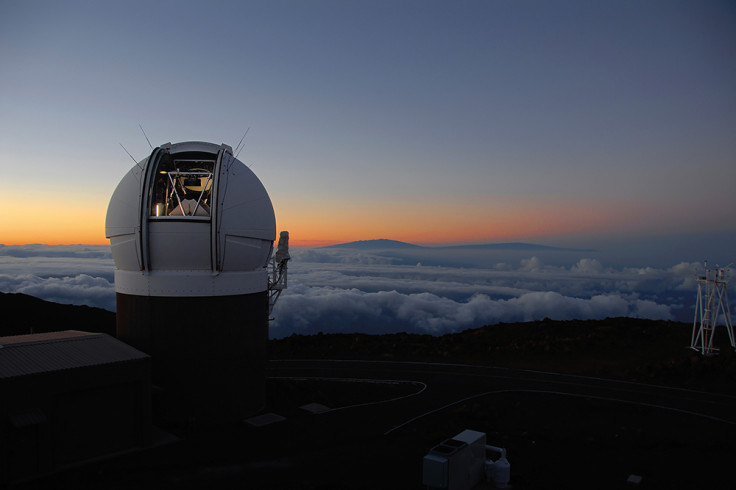
It has taken researchers at institutions including Queen's University Belfast in the UK and Max Planck Institute for Astronomy in Germany several years to put the map together and test the quality of the data. The project began in May 2010 at the Pan-STARRS (Panoramic Survey Telescope and Rapid Response System) observatory.
The data was gathered using a 1.8-metre telescope in Hawaii, at the top of the massive volcano Haleakalā on the island of Maui, mapping the universe in the visible light spectrum and the near infrared.
The Pan-STARRS map makes up 2 petabytes of data, which is equivalent to 100 times the entire content of Wikipedia.
There will be another release of images as part of the Pan-STARRS map released in 2017.
"Our next step then is to measure the redshifts – that means distances – of galaxies and other cosmological objects," says Roberto Saglia, who led the Pan-STARRS contribution from the Max Planck Institute for Extraterrestrial Physics.
"We need this information to analyse the distribution of galaxies in all three dimensions. From this structure, we can then infer the geometry of the universe and further constrain our standard cosmological model. With the data of the individual epochs, we can then even study variability in far-away, active galaxies."
The data from the map are published on the Pan-STARRS website.
© Copyright IBTimes 2025. All rights reserved.
- MOST READ