Nasa observatory reveals high carbon concentrations in southern hemisphere
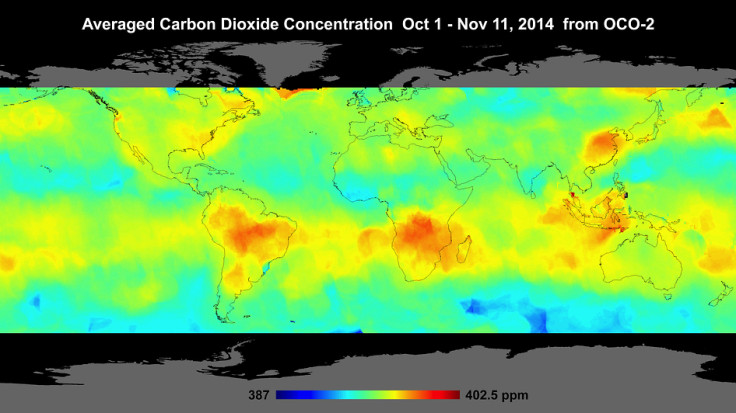
Elevated carbon dioxide concentrations across the Southern Hemisphere from springtime biomass burning are among the highlights of the first global maps generated by Nasa's orbiting carbon dioxide observatory, OCO-2.
High concentrations can also be seen in the region above northern Australia.
The observatory is among an effort to study where carbon dioxide originates from and how it circulates in the atmosphere.
Latest data shows that global carbon emissions stood at 35 billion tonnes in 2013, a record so far.
A global map covering October 1 through November 17 shows elevated carbon dioxide concentrations in the atmosphere above northern Australia, southern Africa and eastern Brazil.
"Preliminary analysis shows these signals are largely driven by the seasonal burning of savannas and forests," said OCO-2 Deputy Project Scientist Annmarie Eldering, of JPL. The team is comparing these measurements with data from other satellites to confirm the connection to biomass burning.
Spikes on the eastern coast of US and over China could indicate emissions from industrialisation.
The impact of landmass clearing and biomass burning on global carbon dioxide has not been well quantified. As OCO-2 acquires more data, the Southern Hemisphere measurements could lead to an improved understanding of the processes that add carbon dioxide to the atmosphere.
The early OCO-2 data also shows some differences with other data.
This could be due to systematic errors of measurement as also gaps in knowledge on carbon sources, says Nasa.
The other measurement from OCO-2 was regarding the small percentage of sunlight re-emitted by plants after photosynthesis.
Measurement of this solar-induced chlorophyll fluorescence adds to OCO-2's carbon dioxide data to tell when and where plants are drawing carbon from the atmosphere.
The large amount of data being collected within a day, around one million measurements across a narrow swath allows researchers to look at features on the five-to-10-kilometre scale.
The instrument can point at a single target on the ground for a total of seven minutes. These targets are stations in the Total Carbon Column Observing Network (TCCON), a collaborative effort of multiple international institutions, which has been collecting carbon dioxide data for about five years.
OCO-2 was sent up in July to help pinpoint the key locations where carbon dioxide is being emitted and absorbed.
The Orbiting Carbon Observatory could provide the information needed to check that nations honour their emission cut pledges. While these are at present not legally binding, there is no mechanism to monitor if nations are on track.
© Copyright IBTimes 2025. All rights reserved.
- MOST READ