Charts in Focus: UK's Economic Collapse and Recovery in Context

The following two charts spell out just how bad the UK economy has had it since the 2008 financial crisis and how it underpins the view of Sir Jeremy Heywood.
The country's top civil servant, Heywood, said that we are looking at a 20 year "generational battle" for economic recovery.
Both are from the Office for National Statistics (ONS), published in its July economic review.
Here is the first. It shows that not only has the decline been deeper than any other economic slump in the past 40 years, but the recovery has been the slowest too.
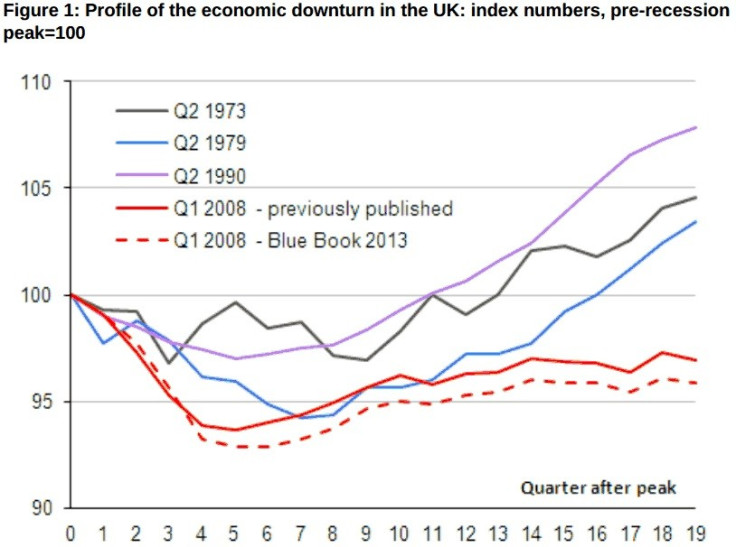
The Blue Book is an annual report from the ONS on the UK's national accounts. The 2013 report is due at the end of July and, as we can see from the above chart, the collapse was sharper than past estimates.
"The revisions suggest that the initial downturn that the UK experienced was deeper than previously thought, as output dropped by 7.2% between the pre-recession peak and the trough, rather than the previous estimate of 6.3%," said the ONS.
"The revisions also delay the onset of the recovery by a quarter, as the economy returned to growth in the final quarter of 2009. By contrast, there have been relatively modest revisions to the growth picture since 2009 which have not altered the picture of the economy over this period."
This second chart shows that, with the exception of Italy, the UK suffered one of the deepest declines of the world's most developed economies - the G7 - and is the slowest to recover. Japan, which saw the worst fall in output, is recovering quicker than the UK.
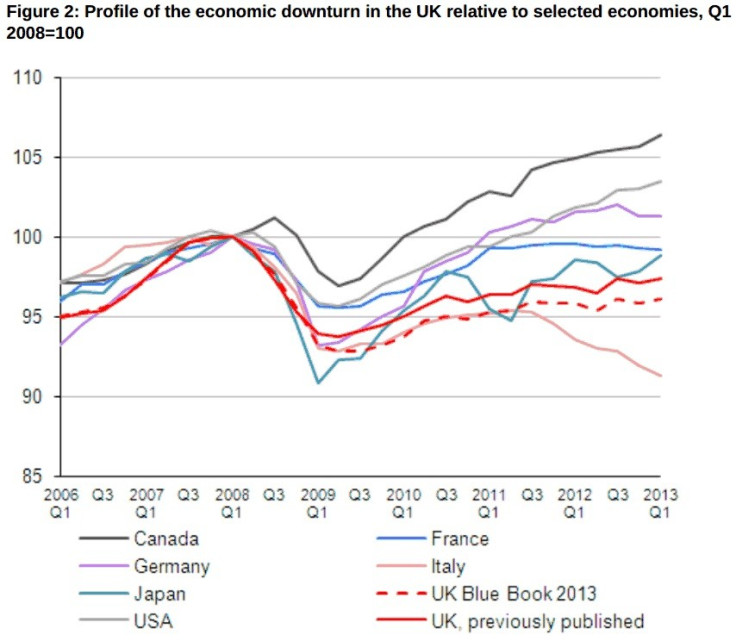
"The revised data have slightly lowered the UK's performance relative to the other G7 economies," said the ONS.
"From this group of countries, only Canada, Germany and the USA have achieved output above the level they attained before the economic downturn in 2008, with Canada performing the strongest.
"France, which followed a broadly similar trajectory to the US during the early phase of the recession, has stagnated since early 2011, while in Italy output continues to contract."
Related articles:
Charts in Focus: Regional Breakdown of UK Wage Plunge Since Financial Crisis
Charts in Focus: FTSE 350 Financials' Profits Tank in 2012
Charts in Focus: Global Catastrophe Risks and Costs
© Copyright IBTimes 2025. All rights reserved.
- MOST READ