

What Do Charts Say For US Dollar Index?

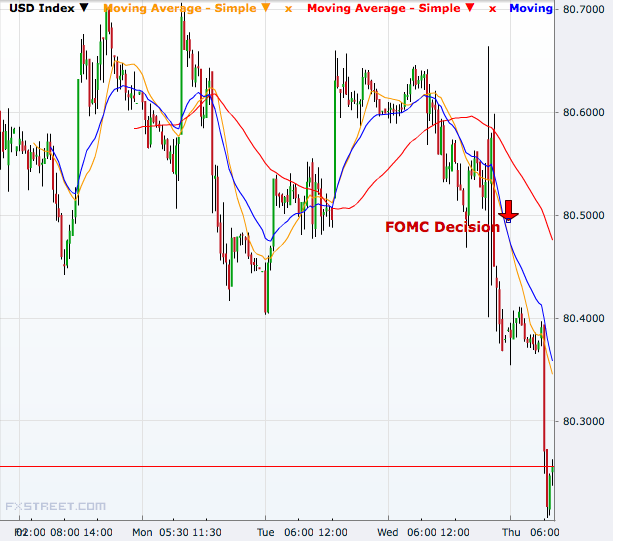
The US dollar weakened on June 18 after the Federal Reserve announced its policy with more concern for growth than inflation, contrary to market expectations. This means there will be more dollars seeking global assets, boosting other currencies for a longer period.
The US dollar index, the gauge that measures the greenback's strength against currencies of the six largest trading partners of the US, dropped to a ten-day low of 80.35 on Thursday, from Tuesday's close of 80.60.
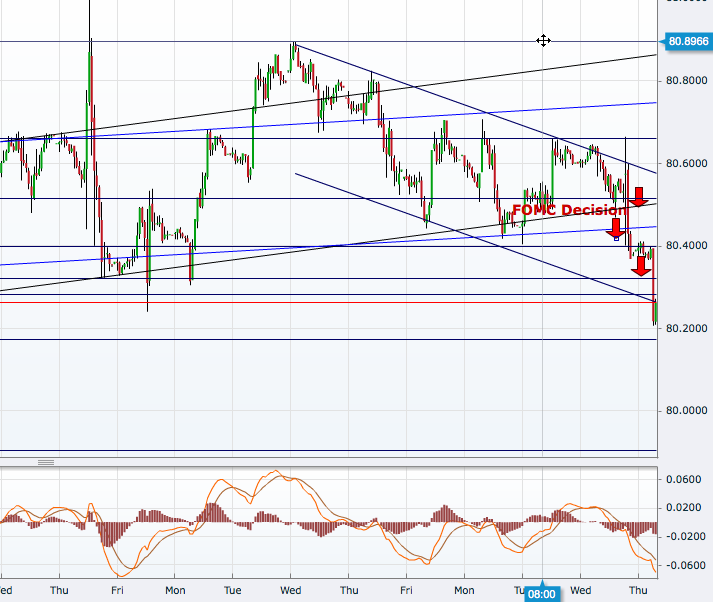
Hourly Chart
The US dollar index has broken below the 50% and 61.8% Fibonacci retracement of the 21 May to 11 June uptrend, helped by the easier dollar outlook after the FOMC policy decision.
With the MACD below zero, the momentum is still downward, and it eyes 80.17 as the next support. Further south, 80.07 is a level to watch ahead of 79.90.
On the higher side, 80.40 has now turned a mild resistance level. What comes ahead are 80.50 and the 80.65-70 region, supported by 38.2% and 23.4% Fibonacci levels. Further up, 80.80-90 will be a more important level.
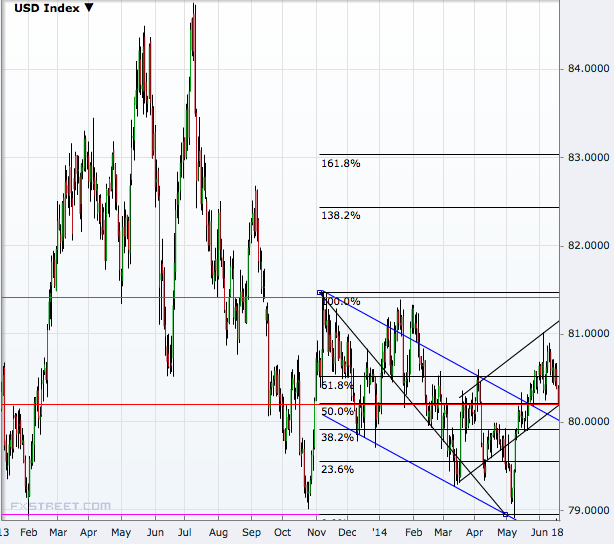
Daily Chart
The index is in a broad sideways range of 78.90-81.50 on the daily chart but there are two shorter term trends - one downward and the other upward - visible inside the sideward track.
The most recent slight uptrend seems to be in question already with the index now testing the channel support and poised to break below. The next downside target is 79.90 and then 79.70 ahead of the sideways track support at 78.90.
On the higher side, a break above 80.65 will resume the uptrend and will aim 81.50, where the channel resistance comes as on Thursday.
With regard to the downtrend, only a break below 79.50 will increase the chances of a break below the sideways track support of 78.90. In between, there are levels like 79.90 and 79.30 to break through, too.
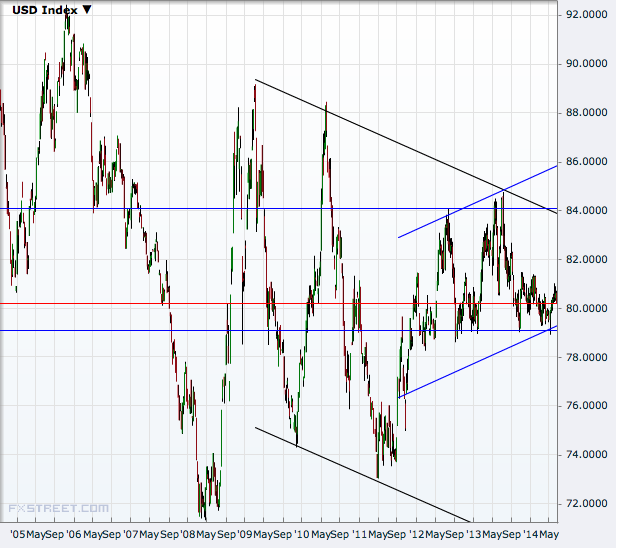
Weekly Chart
There are two major trends visible on the weekly chart: the downtrend since March 2009 and uptrend since August 2011.
A decisive break above 84.00 will challenge the downtrend and keep the uptrend alive but it will meet channel resistance somewhere near 86.00, going forward.
On the downside, a break below 79.00 will destabilise the uptrend, bringing levels like 78.25 and 76.00 in focus ahead of the 2011 low near 73.00.
© Copyright IBTimes 2025. All rights reserved.
- Recommended For You


