Premier Farnell Cautious on Outlook, Keen on Strategic Cost Actions
Premier Farnell, a multi-channel service distributor of information products and technology solutions, is confident that its strategy will deliver sustainable and profitable growth across the economic and product cycles and is scheduled to release its 2011 Q4 earnings on Thursday.
The group is pleased with progress in the execution of its strategy. The business model inherently provides with limited forward visibility, and the current uncertain global economic conditions make it cautious on outlook.
Premier Farnell has taken action to accelerate the further transformation of its cost base to ensure cost efficiency, as the economic environment is uncertain. The group believes that such actions will ensure maximisation of its sales, operating profit and cash positions to drive towards achieving its expectations this year.
Total revenues for the group during Q3 were £241.8 million with operating profits in line with expectations at £25.8 million, giving an industry leading return on sales of 10.7 percent. Adjusted profit before tax in the third quarter was £21.1 million, a decrease of 7.0 percent in the previous year and it reported a profit of 3.8 pence per share.
While commenting on the outlook, CEO Harriet Green said: "The Q3 profit was in line with our expectations, compared with last year's strong performance. Although we remain cautious on the global economic outlook, the business has responded well to the challenging environment and we remain focused on margin management, improving our cost ratios and investing in our strategy. As markets remain uncertain it is encouraging to note that our strategy delivered third quarter operating profit up 40.2% on two years ago when markets were similarly challenged, with sales up by 21.8% over the same period. November sales per day showed progression on Q3 but a small decline from November of last year. Gross margin was up from Q3 levels."
With the focus on web penetration, growth in its EDE active customer base and growth in profitable MRO segments will allow to continue to generate cash and benefit strongly from the recovery when confidence returns, says the group.
Premier Farnell's financial position remains strong with good liquidity and strong free cash flow. Just after the quarter end, it successfully refinanced a 5-year £200m revolving bank facility.
The group continues to make strategic progress and deliver cost efficiencies. Its increasing eCommerce access is providing benefits and leaving it well placed for future additional structural benefits. It also plans and executes strategic cost actions to deliver the efficiencies that are offered by its transformation to place web channels at the forefront of its multi-channel strategy. It anticipates further cost savings of the order of £10 million p.a. which will be phased in over the next 18-24 months.
Brokers' Views:
- Shore Capital Stockbrokers recommends "Hold" rating on the stock
- Seymour Pierce assigns "Outperform" rating
- Credit Suisse gives "Hold" rating
- Jefferies & Co assigns "Buy" rating with a target price of 230 pence per share.
Earnings Outlook:
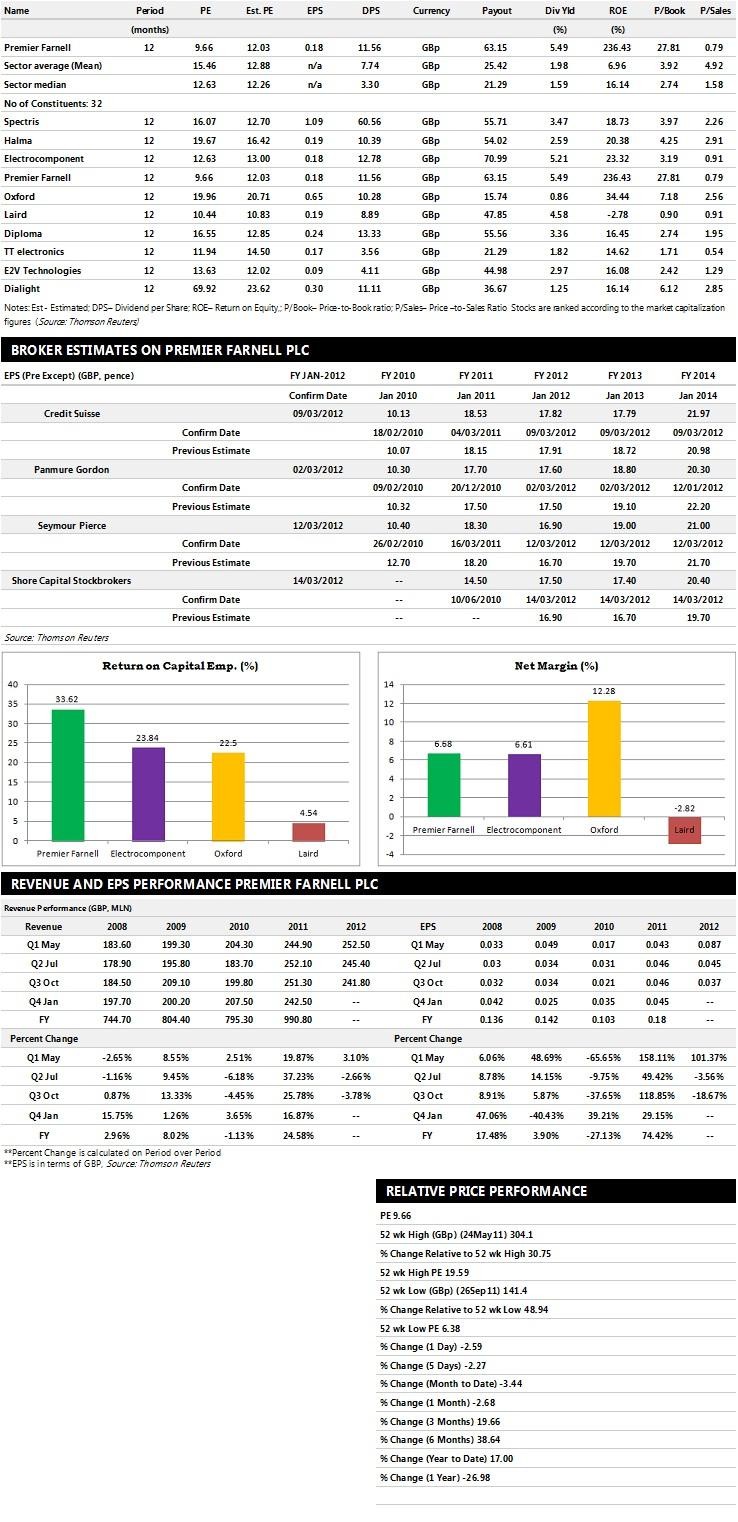
- Shore Capital Stockbrokers estimates the company to report revenues of £977.20 million and £983 million for the FY 2012 and FY 2013 respectively with pre-tax profits (pre-except) of £88.80 million and £90.50 million. Earnings per share are projected at 17.50 pence for FY 2012 and 17.40 pence for FY 2013.
- Seymour Pierce projects the company to record revenues of £972.50 million for the FY 2012 and £997.20 million for the FY 2013 with pre-tax profits (pre-except) of £90.10 million and £94.60 million. Profit per share is estimated at 16.90 pence and 19.00 pence for the same periods.
- Credit Suisse expects Premier Farnell to earn revenues of £972 million for the FY 2012 and £975 million for the FY 2013 respectively with pre-tax profits of £89 million and £88 million. EPS is projected at 17.82 pence for FY 2012 and 17.79 pence for FY 2013.
Below is a summary of sector comparisons in terms of price earnings, earnings per share, dividend per share, dividend yields, return on equity and price-to-book ratio. The table explains how the company is performing against its peers/competitors in the sector. The table below represents top ten companies based on market capitalisation.

© Copyright IBTimes 2025. All rights reserved.


