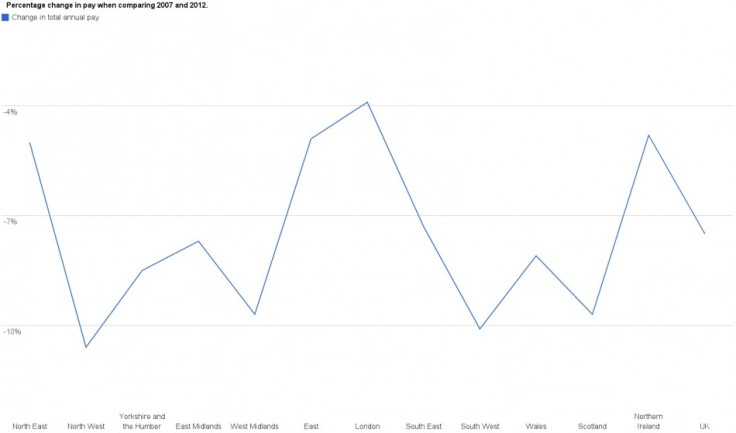
The TUC has released research showing that UK wages have sunk by £52bn since the start of the financial crisis, but one of the most compelling - and depressing - bits of its analysis is in the regional breakdown.
When comparing the total pay packet in 2012 with that in 2007, the north west region of England has seen the worst drop - a staggering 10.6%.
This is way above the UK's overall average fall of 7.5%.
Using the TUC's data, IBTimes UK whipped up a quick line chart to show how, by region, wages have declined in that period.
Line chart showing the regional breakdown of the UK total pay packet decline when comparing 2007 and 2012.
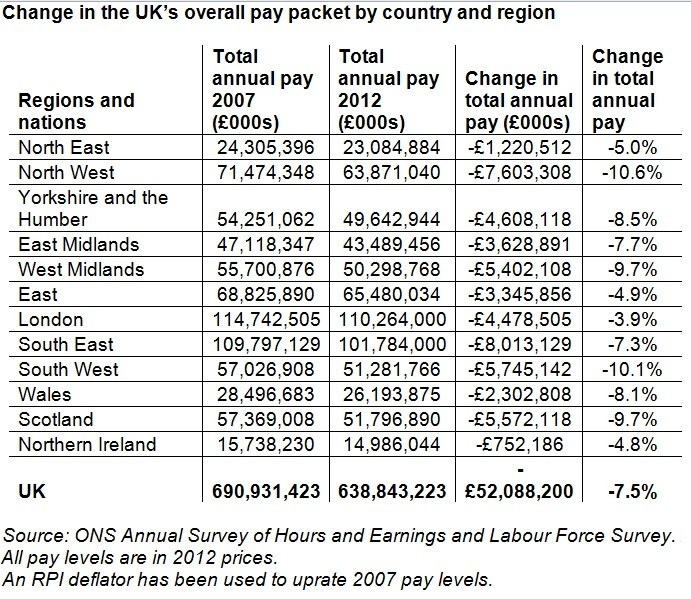
Here's the TUC data table on the regional breakdown: