Is Apple Really Overbought? Charts See $100.5 per Share Despite Short-term Bearishness

Apple Inc has always fascinated buyers of phones and computers everywhere and so have responded the investor community, helping it remain one of the most valuable stocks.
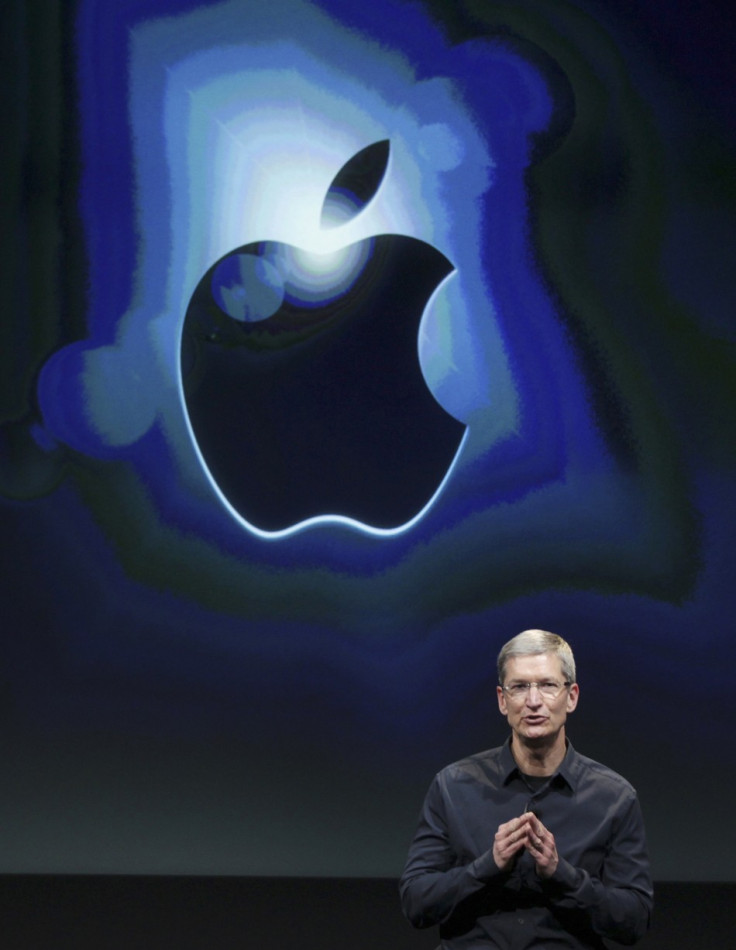
At the same time, the Apple-will-only-rally theory has always been questioned. The pessimists argued that CEO Tim Cook is in no way a match for Steve Jobs, and therefore nothing great is going to be added to the company's product range.
A lot of people, including investors, have lent ears to this argument. They, however, have not yet got a strong enough reason to press the long-term bearish button.
The concerns are now back to the investors' table, this time served by the New York Times. An article in it has listed many reasons -- old and new -- why Apple and its leader have little room to sell.
And Apple's supporters and fan sites have responded angrily. An article in Appleinsider says the NYT piece is another example of skewed reporting on the iPhone maker.
Here's a look at where the share price is heading, explained with the help of technical charts:
Apple shares have rallied sharply over the recent months, mainly helped by the stock split in April, and also on increased buybacks and dividend payouts. From end-2013, Apple shares were 13.89% stronger at Friday's close.
However, the stock then dropped nearly 4.38% and ended at a 9-day low of $91.28 on Friday.
What Charts Say
Broader technical charts show that Apple shares have some more levels to achieve on the higher side, but a bearish signal has been triggered for the short term, which is likely to keep some downside levels in the focus for the coming days.
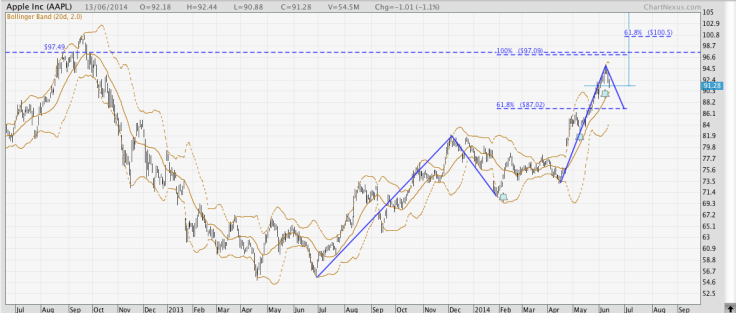
Projections Upward
The Fibonacci projection with the swing low on 28 June 2013, high on 5 December and the third point at the end-January low of $70.50 shows that the stock has resistance at $86.92 (the 61.8% projection, which has already proved to be a resistance for a few days before getting broken above) and then at $97.06 (the 100% projection).
Another Fibonacci projection with the swing low at $73.88 on 14 April, high at $95.05 on 10 June and the third point at the previous projection's 61.8% level of $86.92 - which is likely to be a strong support now - shows that the stock has resistance first at $100.5, the 61.8% projection, which also falls a tad the 2012 peak of $100.72.
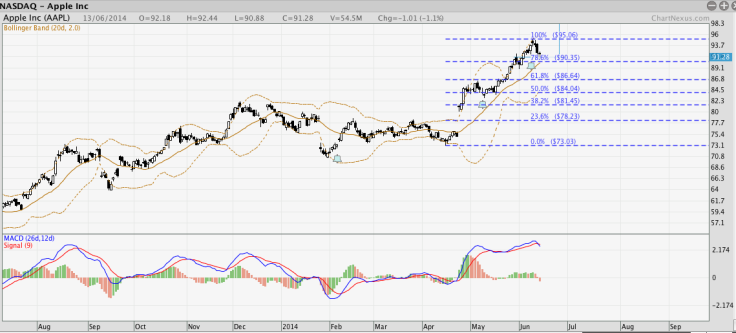
Supports
MACD above zero shows that broader momentum is still upward. However, for the short term, a bearish signal has been triggered with the MACD line just crossing below its signal line.
As per the Fibonacci retracement of the 15 April-10 June uptrend, the stock has support first at $90.35, the 78.6% level, and then at $86.64, the 61.8% level, ahead of $84.04, which is a much stronger one.
A break below $84.04 will reverse the uptrend since mid-April, and then the stock may easily fall to $78.23, the 23.6% level with the 38.2% level of $81.45 seems weak. Such a fall can eventually lead to a sideways range of $70-$80.
© Copyright IBTimes 2025. All rights reserved.
- MOST READ