Warren Buffett's Market Indicator Tops 232.1% as US Stocks Trade at Extreme Valuations — Why It Matters
Warren Buffett's indicator has surged close to such levels only a handful of times in the past 60 years

Warren Buffett's time-tested stock market gauge just surged to an all-time high of 232.1%, showing that US stock valuations have reached extreme levels. The indicator divides the total US stock market capitalization by the size of the US economy measured by gross national product (GNP).
Although GNP differs from GDP, both have historically been within 1% of each other. For calculation purposes, we used the US GDP figure to arrive at the 232.1% reading.
Historically, such elevated Buffett indicator levels have been precursors to market downturns. In the late 1960s, Buffett's indicator approached similarly high levels, as it did in 2000 during the dot-com bubble, and again in late 2021. After the 2021 peak of 197%, the US stock market experienced a prolonged bear market. Similarly, when the indicator hit 190% during the dot-com bubble, the market subsequently declined sharply.
For a long time, Buffett has regarded this indicator as 'probably the best single measure of where valuations stand at any given moment.' Traditionally, the reading has hovered between 40% and 100%.
In 2001, Buffett had cautioned that the market was 'playing with fire' when the indicator climbed too high. While this metric is not intended as a precise market timing tool, it serves as a warning of potential upcoming economic risks. The current reading suggests that the gap between stock prices and economic output is unusually wide, raising concerns about the prospects for near-term returns.
However, investors should note that current market dynamics differ from a few decades ago. Back then, markets were typically dominated by smokestack industries and cyclical companies. Today, the S&P 500 is largely driven by tech giants like Apple, Alphabet, Nvidia, and Microsoft. These firms are often less tied to traditional economic cycles, which could influence how valuation metrics like Buffett's indicator behave relative to past periods.
How Much in Returns Can You Expect From Today's Stock Market?
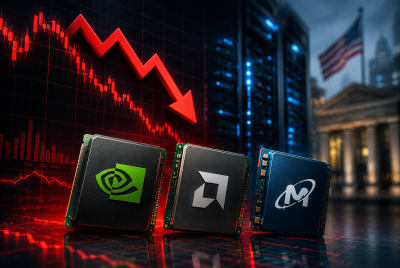
While the extreme US megacap tech valuations raises risks of potential volatility and a major price correction in the future as investors and hedge funds worry about an AI bubble, the higher chances of the US Federal Reserve boosting interest rates due to surging inflation poses another headwind for stocks.
The latest report from the US Department of Labor showed that inflation in May reached its highest since early 2023, to an annual rate of 4.2%, up from 3.8% in April, driven by skyrocketing energy costs. Note that the Fed likes to keep inflation at 2%.
Buffett believes that interest rates act on financial valuation the way gravity acts on matter. 'The higher the rate, the greater the downward pull. That's because the rates of return that investors need from any kind of investment are directly tied to the risk-free rate that they can earn from government securities. So, if the government rate rises, the prices of all other investments must adjust downward, to a level that brings their expected rates of return into line,' The Oracle of Omaha had stated earlier.
In short, inflation and interest rates share an inverse relationship. Central banks hike rates to cool down inflation and lower rates when it plans to stimulate economic growth.
According to GuruFocus estimates based on historical stock market valuations, the US stock market is currently poised for an average annualised return of minus 1%, including returns from dividends.
Buffett's 'Mr. Market' Analogy for Volatile Markets
Buffett's investment philosophy focuses on recognising the intrinsic value of assets, often illustrated through his characterisation of 'Mr. Market'.
Mr. Market is a metaphor for the stock market's daily mood swings, which can be triggered by emotions rather than market fundamentals.
'Mr. Market is there to serve you, not to guide you,' Buffett has explained. 'It is his pocketbook, not his wisdom, that you will find useful.'
The concept was introduced by Buffett's mentor, Benjamin Graham, widely known as the father of value investing. Graham created the metaphor of Mr. Market to illustrate the irrational behaviour often seen in stock markets. Buffett learned from Graham at Columbia Business School and later worked under him at his investment firm.
Buffett had observed that 'the more manic depressive his behaviour, the better for you.'
According to him, when Mr. Market is euphoric, he overpays for stocks, but sells quality assets at bargain prices when depressed. The wider the emotional swings, the more opportunities disciplined investors have to buy undervalued assets or sell overvalued ones.
Disclaimer: Our digital media content is for informational purposes only and does not constitute investment advice. Please conduct your own analysis or seek professional advice before investing. Remember, investments are subject to market risks, and past performance does not guarantee future returns.
© Copyright IBTimes 2025. All rights reserved.
- Recommended For You